rundfunk-mitbestimmen
 rundfunk-mitbestimmen copied to clipboard
Visualize/geo: Display the percentage of supporters for one broadcast in 16 German federal states
-
I'm submitting a ...
- feature request
-
What is the current behavior? The distribution of users (in absoulute numbers :disappointed:) is shown for every German federal state: https://rundfunk-mitbestimmen.de/visualize/geo
-
What is the expected behavior? When I visit https://rundfunk-mitbestimmen.de/visualize/geo/42 I should see either a choropleth map or a bubble map for broadcast 42. It should display the
approvalof the broadcast but only for users from that area. -
What is the motivation / use case for changing the behavior? Much of German public broadcasting, some TV broadcasts and almost all the radio shows, are targeted on local issues. It would be interesting to see if there is a correlation?
-
If you want to request a whole new feature, please provide a user story (otherwise delete):
- As a
broadcaster - I want
to interact with a choropleth map or a bubble map for every broadcast - So that
to see in wich areas of Germany a broadcast is especially popular
- As a

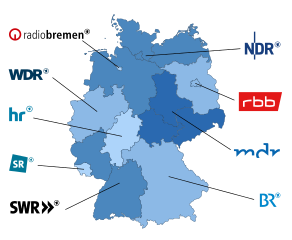
This is especially interesting because public broadcasters in Germany are organized federally:
Choropleth map

Bubble map

The advantage of the bubble map is that we could encode the total numbers of positive and neutral votes in the size of the bubbles. The disadvantage of bubbles is that they may overlap.