Adding better time range reactivity
closes #707 Fixes dashboard flicker because of switch from all time calculated time grain to default time range and grain. Also makes the default entity be the explorer when clicking on left bar. Without the changes in this PR, the time series was not rendering correctly.
To close #707, we should also rename the "METRICS" section to "DASHBOARDS" and use the Dashboard icon.
@AdityaHegde , overall I really love this approach and nav change!
As proposed in the issue, navigation should default to the metrics config if there is a problem with the dashboard that makes it invalid. I read this as entirely invalid, I don't mind if there are measures or dimensions that are invalid and held back. However, if there are no measures, no dimensions, or no timeseries I expect to be taken to the config when I click the asset. In this branch I am only taken to the config when I have a new metrics asset created. Could we update the flow with these changes?
One more thing to close #707, when you click the + button to "create a new dashboard", the asset should be named dashboard_1 rather than metrics 1.
In this commit 7a36206, I changed dashboards autogenerated from a model to be named mymodel_dashboard rather than metrics_mymodel. Which aligns with the suffix approach in #753 and gets us half of the way there.
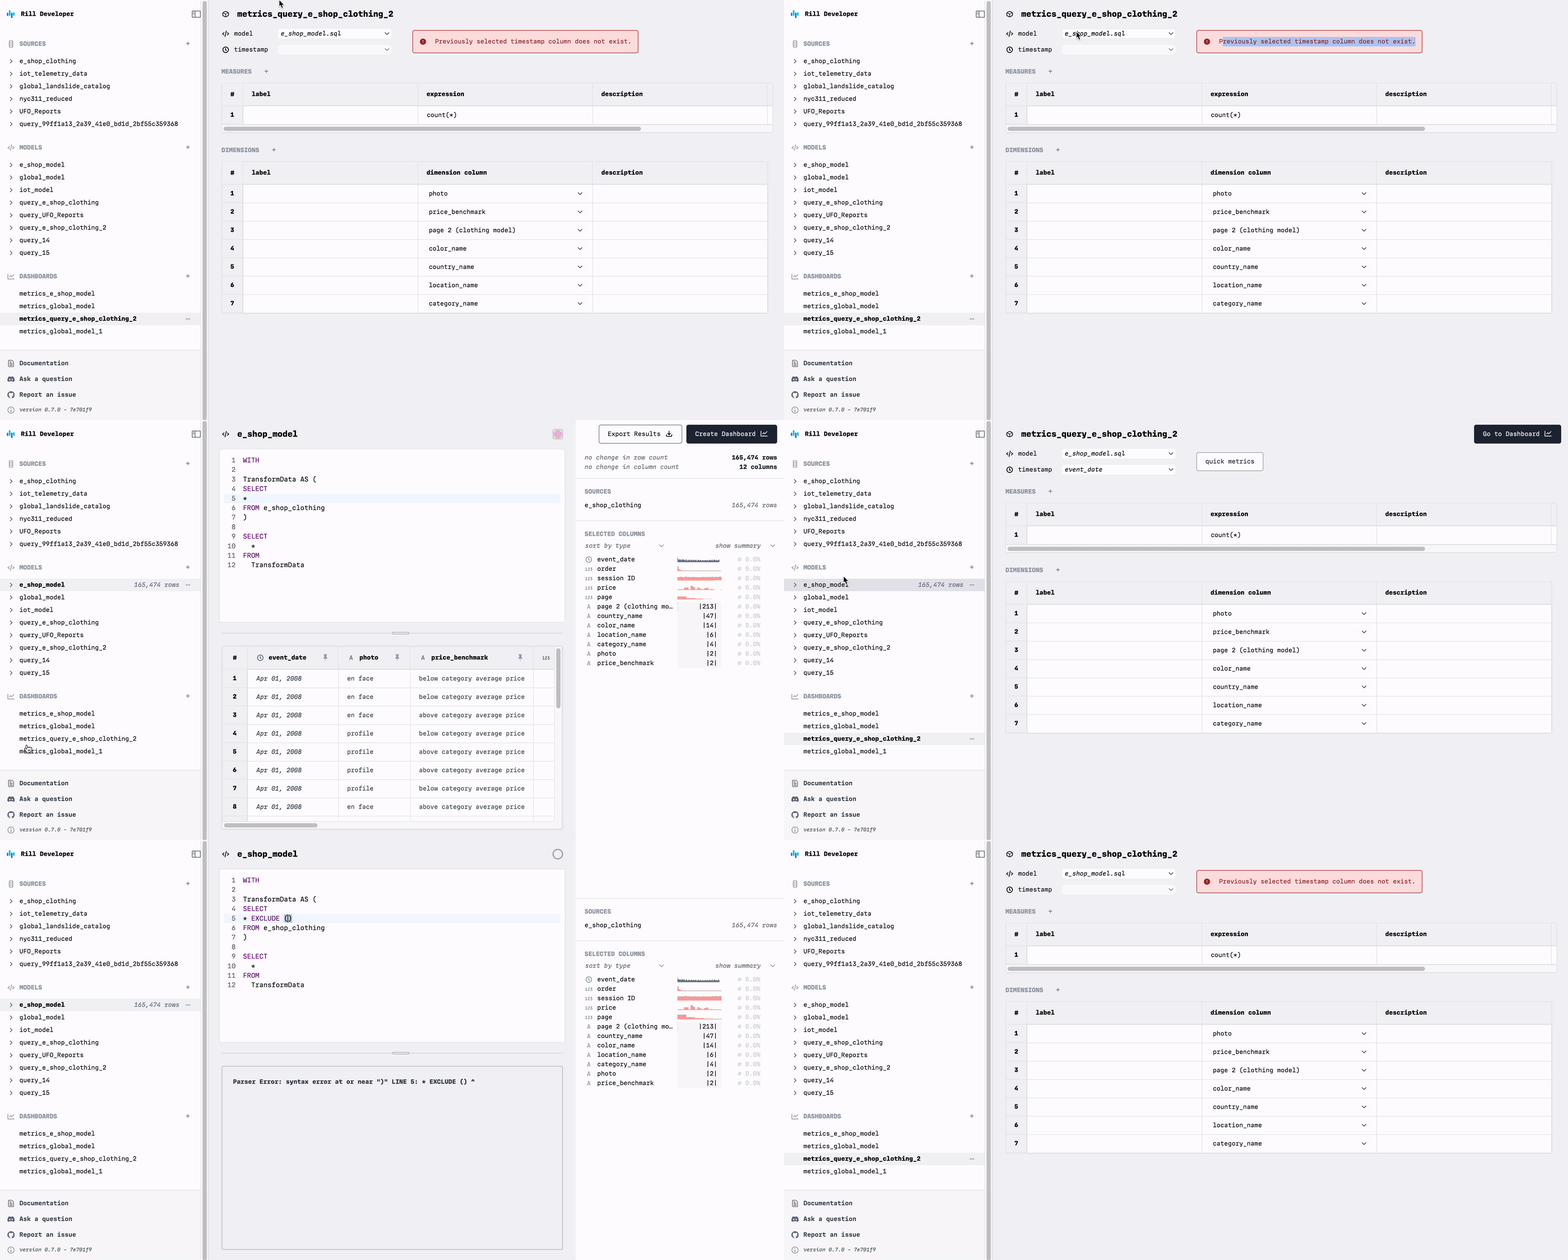
I have rereviewed this PR and had the same outcome. When the timeseries information is absent the metrics config is invalid and you are taken to the older version of the dashboard. When you refresh it recognizes the model file has no timeseries.

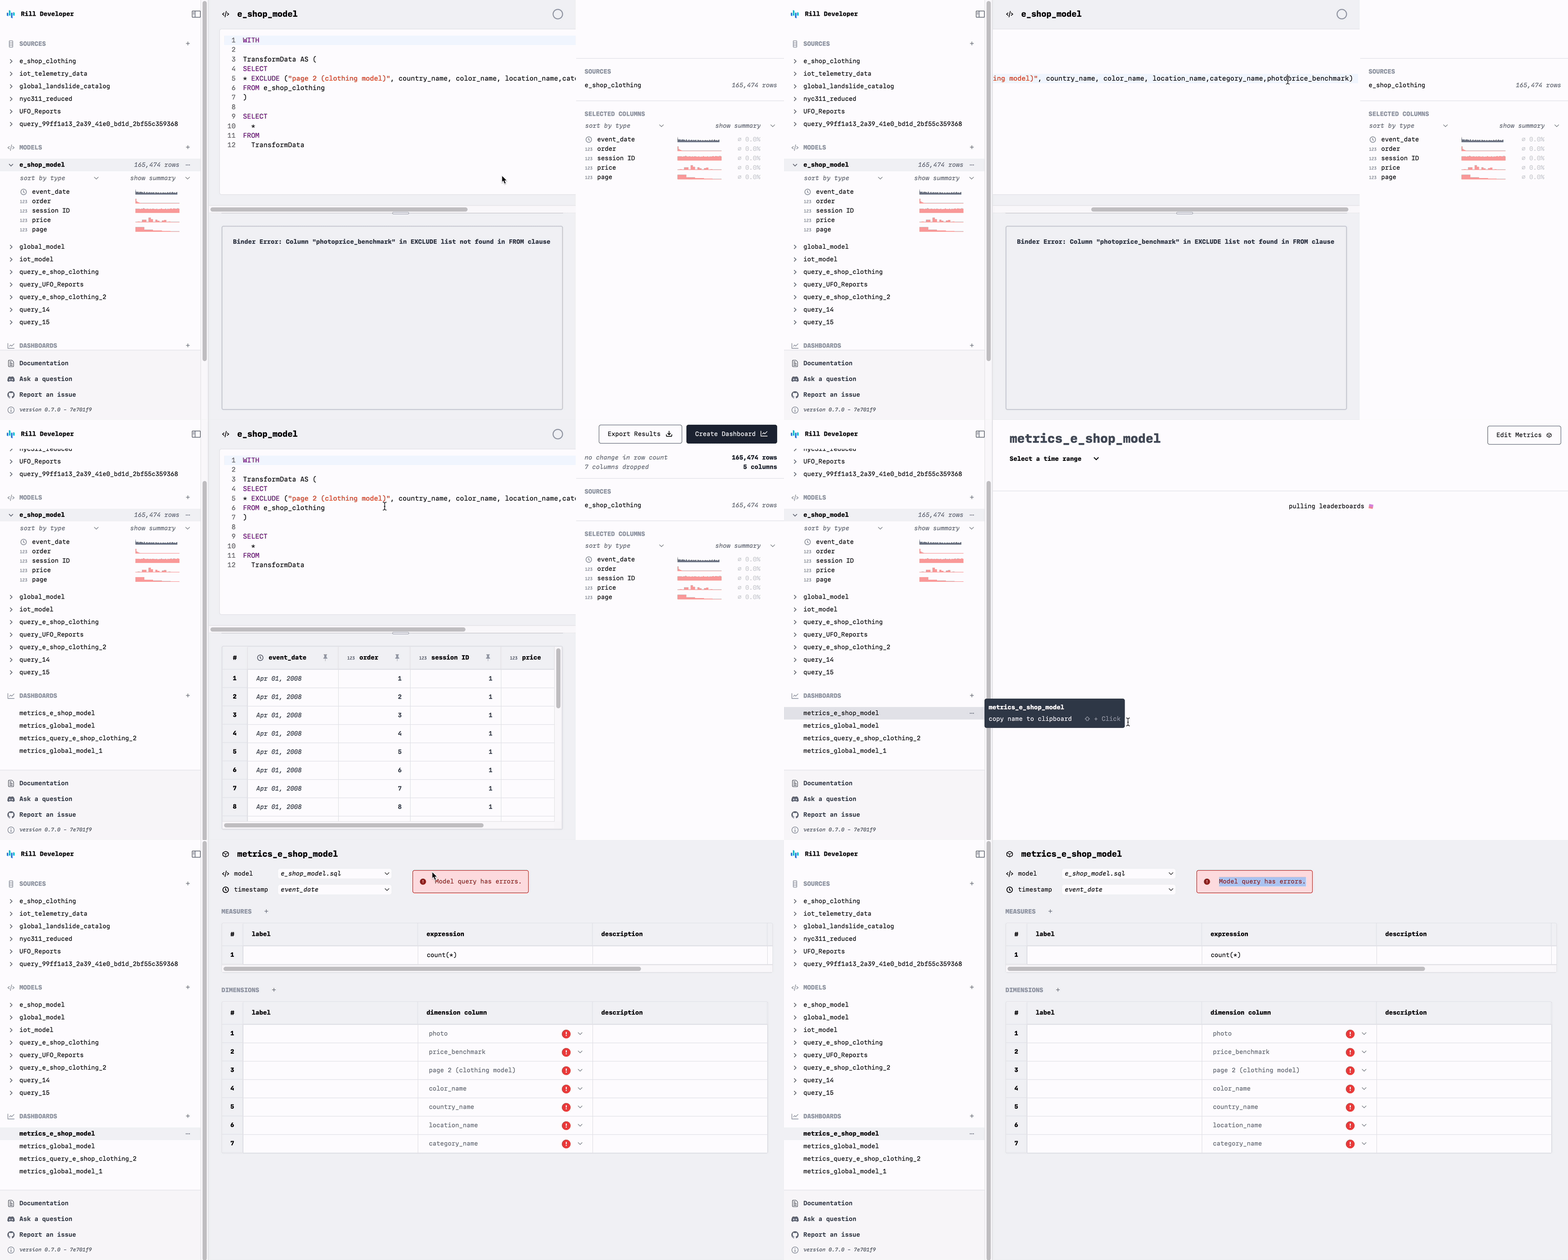
I also ran into another case. When you have a problem in the query that totally prevents it from running it makes the metrics invaild, however you are taken to a broken dashboard and the application is frozen. when you refresh you are taken to the config as expected, but the error feedback is a little off (keeps the old error messages here from when I had removed all of the dimensions during testing). More problematic than the former.

@AdityaHegde , you said in a DM that recognizing the timeseries is missing is not possible with current state management. Is that right? Does that extend to this second case? @hamilton what do you think about shipping with this type of breakage. I don't want to totally block but it seems to add some magic and also some chaos.
I think in the interestg of getting this in for 0.8, @AdityaHegde would you mind taking a look at the second one (the broken dashboard w/ frozen app) case? I think once that's fixed, we should merge this. For the other case, it doesn't probably make a lot of sense to spend time fixing it before we refactor the metrics config state.
The issue with timeseries isnt that we do not recognise it. It is to do with editing model files directly. If you add the exclude in the UI and go to metrics it will throw and error saying model has errors. Same with invalid model queries.
I have fixed the crashing issue when changes are done through the UI. But editing model directly can cause issues.
Just verified that Marissa's 2nd case has been fixed, so I'm going to merge this in now.