linemap
 linemap copied to clipboard
Create maps made of (ridge) lines
![]()
![]()
linemap: Create Maps Made of Lines 
Example
The package contains two functions: linemap() and getgrid()
linemap()
linemap() displays a map made of lines using a data frame of gridded data.
library(linemap)
library(sf)
data("popOcc")
occitanie <- st_read(system.file("gpkg/geofla.gpkg",
                                 package = "linemap"),
                     layer = "Occitanie")
opar <- par(mar=c(0,0,0,0), bg = "ivory2")
plot(st_geometry(occitanie), col="ivory1", border = NA)
linemap(x = popOcc, var = "pop", k = 2.5, threshold = 50,
        col = "ivory1", border = "ivory4", lwd = 0.6, add = TRUE)
par(opar)

getgrid()
getgrid() transforms a set of polygons (sf objects) into a suitable data frame for linemap().
library(linemap)
library(sf)
bretagne <- st_read(system.file("gpkg/geofla.gpkg",
package = "linemap"),
layer = "Bretagne")
france <- st_read(system.file("gpkg/geofla.gpkg",
package = "linemap"),
layer = "France")
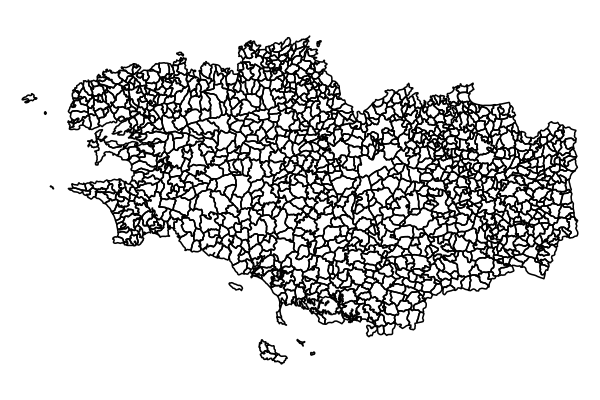
plot(st_geometry(bretagne))
bret <- getgrid(x = bretagne, cellsize = 2000, var = "POPULATION")
bret[6010:6014,]
| X | Y | POPULATION | |
|---|---|---|---|
| 6010 | 340217.1 | 6783195 | 670.7509 |
| 6011 | 342217.1 | 6783195 | 1050.2651 |
| 6012 | 344217.1 | 6783195 | 1410.0992 |
| 6013 | 346217.1 | 6783195 | 2304.2012 |
| 6014 | 348217.1 | 6783195 | 2875.4047 |
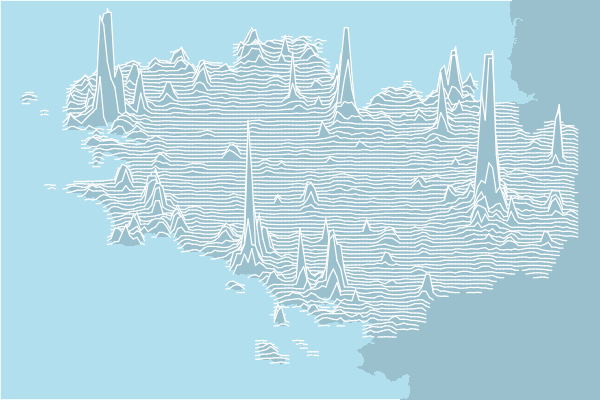
opar <- par(mar = c(0,0,0,0))
plot(st_geometry(france), col="lightblue3", border = NA, bg = "lightblue2",
     xlim = c(min(bret$X), max(bret$X)), ylim= c(min(bret$Y), max(bret$Y)))
linemap(x = bret, var = "POPULATION", k = 5, threshold = 1,
        col = "lightblue3", border = "white", lwd = 0.8,
        add = TRUE)
par(opar)
Blogposts
linemap (rgeomatic)
Graphiques linéaires géospatiaux (MTMX):

Installation
Stable
install.packages('linemap')
Dev
library(devtools)
install_github("riatelab/linemap")
Inspiration
Unknown Pleasures (Joy Division)
Population Lines: How and Why I Created It (James Cheshire)
GeospatialLineGraphs (Ryan Brideau)
Alternative
- ggplot2 + ggridges