grafana-dashboards
 grafana-dashboards copied to clipboard
Error in many panels with Grafana v8.3.4
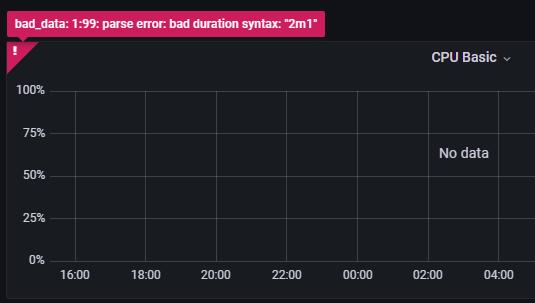
Hello, Since upgrading to Grafana v8.3.4, a number of panels are throwing the following error : bad_data: 1:187: parse error: bad duration syntax: "1m1" A typical example is the very first panel "CPU Busy" which now shows N/A Any help will be appreciated
I removed all the $interval variables in the json, now it is all working again.

 Hello.
Nearly same issue here. I guess this is quite the same reason.
Good luck
Hello.
Nearly same issue here. I guess this is quite the same reason.
Good luck
@rfrail3 Will this issue be addressed in terms of an update with fix(es)?
Thank you for all of your efforts. 👍
Fixed by upgrading prometheus https://github.com/grafana/grafana/issues/44251
I had the same issue. I was using Ubuntu's apt repo but I noticed those have old versions of prometheus and prometheus-node-exporter.
I have manually updated them to latest released versions and I don't get that error anymore.
Proof - screenshot of dashboard after upgrading

I also can't confirm this issue. Using latest grafana, prometheus and node-exporter and there are no issues on my dashboard.
Thera re only some blank graphs (with advanced metrics I don't need) but that's definitely because I haven't enabled some collectors.
@LosTigeros @northys which node_exporter Version do you use? I have still the same issue using Prometheus 2.35 (also Docker?) and node_exporter 1.3.1, Grafana 8.4.7
which node_exporter Version do you use? I have still the same issue using Prometheus 2.35 (also Docker?) and node_exporter 1.3.1, Grafana 8.4.7
docker:
Starting Grafana                         logger=settings version=8.4.2 commit=dea7d4996a branch=HEAD compiled=2022-02-24T11:19:31+0000

/prometheus $ prometheus --version
prometheus, version 2.34.0 (branch: HEAD, revision: 881111fec4332c33094a6fb2680c71fffc427275)
  build user:       root@121ad7ea5487
  build date:       20220315-15:18:00
  go version:       go1.17.8
  platform:         linux/amd64
installed using ansible role https://github.com/cloudalchemy/ansible-node-exporter
root@nuc ~/docker-prometheus # node_exporter --version
node_exporter, version 1.3.1 (branch: HEAD, revision: a2321e7b940ddcff26873612bccdf7cd4c42b6b6)
  build user:       root@243aafa5525c
  build date:       20211205-11:09:49
  go version:       go1.17.3
  platform:         linux/amd64
which node_exporter Version do you use?
Grafana: 8.4.6 node_exporter: 1.3.1 Prometheus: 2.34
I guess I have double checked everything.. it is not working in my case on a rPi 4
this is all i can provide to you...
docker-compose.yml
version: '3.8'

services:
  grafana:
    image: grafana/grafana
    ports:
      - "127.0.0.1:3000:3000/tcp"
    environment:
      GF_RENDERING_SERVER_URL: http://grafana-renderer:8081/render
      GF_RENDERING_CALLBACK_URL: http://grafana:3000/
      GF_INSTALL_PLUGINS: grafana-image-renderer,grafana-piechart-panel
    restart: unless-stopped
    links:
      - prometheus
    volumes:
      - "grafana:/var/lib/grafana"

  grafana-renderer:
    image: grafana/grafana-image-renderer:latest

  prometheus:
    image: prometheus
    build:
      context: .
      dockerfile: Dockerfile.prometheus
    restart: unless-stopped
    command:
      # default
      - --config.file=/etc/prometheus/prometheus.yml
      - --storage.tsdb.path=/prometheus
      - --web.console.libraries=/usr/share/prometheus/console_libraries
      - --web.console.templates=/usr/share/prometheus/consoles
      # custom
      - --storage.tsdb.retention.time=365d
      - --web.enable-admin-api # insecure
    ports:
      - "127.0.0.1:9090:9090/tcp"
    links:
      - alertmanager
    volumes:
      - prometheus-data:/prometheus

  alertmanager:
    image: alertmanager
    build:
      context: .
      dockerfile: Dockerfile.alertmanager
    restart: unless-stopped
    ports:
      - "127.0.0.1:9093:9093/tcp"
    links:
      - alertmanager-bot

volumes:
  prometheus-data:
    external: true
  grafana:
    external: true
prometheus.yml (removed everything not important)
scrape_configs:
  # SELFMONITORING
  - job_name: 'prometheus'
    scrape_interval: 5s
    static_configs:
      - targets: ['localhost:9090']

  # EXPORTERS
  - job_name: 'home'
    static_configs:
      - targets:
          - "172.17.0.1:9100" # node_exporter
        labels:
          instance: homelab-server
also I have imported the dashboard using ID copied from grafana dashboard catalog... it's possible that newer version or something imported directly as json from this repository may be broken...
how did you add the dashboard to your grafana?
I have also added it using the ID. I do use Grafana via docker.. I will beginn from the scrath and use grafana docker since the latest build 8.5 is not starting any more.. bug: https://github.com/grafana/grafana/issues/48130
Same issue here:
node_exporter natively
/usr/local/bin/node_exporter --version
node_exporter, version 1.3.1 (branch: HEAD, revision: a2321e7b940ddcff26873612bccdf7cd4c42b6b6)
  build user:       root@2efabfa20624
  build date:       20211205-11:09:40
  go version:       go1.17.3
  platform:         linux/arm
Using the following docker images:
- prom/prometheus:v2.35.0
- grafana/grafana:8.5.2
Had the same issue on Node Exporter 1.3.1, Prometheus 2.35, Grafana 8.5.2 and node-exporter-full.json Dashboard version 67
Changing Scrape Interval of Prometheus Data Source in Grafana to the actual scrape interval of Prometheus (1m in my case) fixed all panels. It has something to do with rate() function. See https://github.com/rfrail3/grafana-dashboards/issues/72
same issue as jakubvondrak on Node Exporter 1.3.1, Prometheus 2.35, Grafana 8.5.2 and node-exporter-full.json on rpi 2. i manage to fix this with this way , replace the [$__rate_interval] with [$__range] and worked again with no problems , but i have no idia if is the correct way to fix this problem .
Test clean install on debian 11 x64 with the same as above , and works out off the box....
I have the same issue, the fix of @pantgr did the job and everything is working fine now :)

I fixed by updating to the latest of these containers in docker-compose.yml
grafana/grafana:latest prom/node-exporter:latest prom/prometheus:latest
Looks like same thing to me. Fresh installment of the latest version.
@pantgr's method helped, thanks