formattable
 formattable copied to clipboard
Question - combine area function with digits function
I know how to combine the area function with the percent function as long as I do not write '()' after "percent" like so:
library(magrittr)
library(formattable)
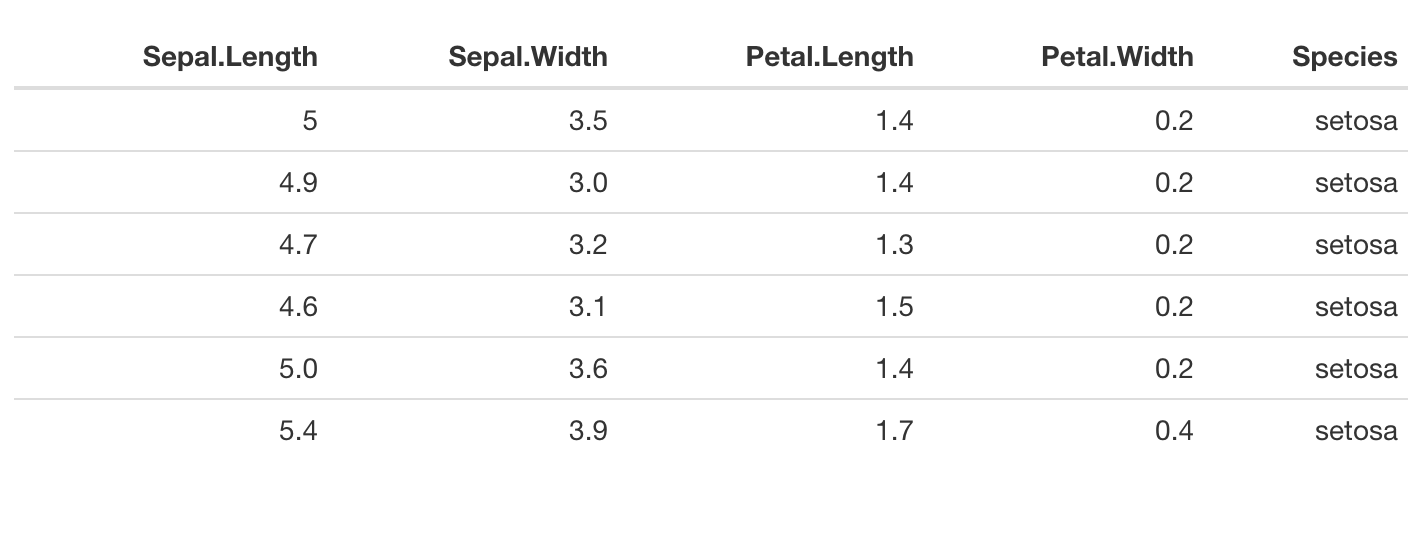
iris_head <- iris %>% head()
iris_head %>% formattable(
list(
area(row = 1, col = 1) ~ percent
)
)
This code returns this:
<table class="table table-condensed table table-condensed">
 <thead>
  <tr>
   <th style="text-align:right;"> Sepal.Length </th>
   <th style="text-align:right;"> Sepal.Width </th>
   <th style="text-align:right;"> Petal.Length </th>
   <th style="text-align:right;"> Petal.Width </th>
   <th style="text-align:right;"> Species </th>
  </tr>
 </thead>
<tbody>
  <tr>
   <td style="text-align:right;"> 510.00% </td> <!-- WORKED -->
   <td style="text-align:right;"> 3.5 </td>
   <td style="text-align:right;"> 1.4 </td>
   <td style="text-align:right;"> 0.2 </td>
   <td style="text-align:right;"> setosa </td>
  </tr>
  <tr>
   <td style="text-align:right;"> 4.9 </td>
   <td style="text-align:right;"> 3.0 </td>
   <td style="text-align:right;"> 1.4 </td>
   <td style="text-align:right;"> 0.2 </td>
   <td style="text-align:right;"> setosa </td>
  </tr>
  <tr>
   <td style="text-align:right;"> 4.7 </td>
   <td style="text-align:right;"> 3.2 </td>
   <td style="text-align:right;"> 1.3 </td>
   <td style="text-align:right;"> 0.2 </td>
   <td style="text-align:right;"> setosa </td>
  </tr>
  <tr>
   <td style="text-align:right;"> 4.6 </td>
   <td style="text-align:right;"> 3.1 </td>
   <td style="text-align:right;"> 1.5 </td>
   <td style="text-align:right;"> 0.2 </td>
   <td style="text-align:right;"> setosa </td>
  </tr>
  <tr>
   <td style="text-align:right;"> 5.0 </td>
   <td style="text-align:right;"> 3.6 </td>
   <td style="text-align:right;"> 1.4 </td>
   <td style="text-align:right;"> 0.2 </td>
   <td style="text-align:right;"> setosa </td>
  </tr>
  <tr>
   <td style="text-align:right;"> 5.4 </td>
   <td style="text-align:right;"> 3.9 </td>
   <td style="text-align:right;"> 1.7 </td>
   <td style="text-align:right;"> 0.4 </td>
   <td style="text-align:right;"> setosa </td>
  </tr>
</tbody>
</table>
But I do not know how to use the digits function in the same manner
library(magrittr)
library(formattable)

iris_head <- iris %>% head()

iris_head %>% formattable(
  list(
    # area(row = 1, col = 1) ~ percent
    # ,
    area(row = 2, col = 2) ~ digits(digits = 0)
    )
  )
throws
Error in formattable(as.numeric(x), format = format, digits = digits,  :
  argument "x" is missing, with no default
and
library(magrittr)
library(formattable)

iris_head <- iris %>% head()

iris_head %>% formattable(
  list(
    # area(row = 1, col = 1) ~ percent
    # ,
    area(row = 2, col = 2) ~ digits
    )
  )
throws the same error
Error in formattable(as.numeric(x), format = format, digits = digits,  :
  argument "digits" is missing, with no default
and
library(magrittr)
library(formattable)

iris_head <- iris %>% head()

iris_head %>% formattable(
  list(
    # area(row = 1, col = 1) ~ percent
    # ,
    area(row = 2, col = 2) ~ digits(x, digits = 0)
    )
  )
throws
Error in formattable(as.numeric(x), format = format, digits = digits,  :
  (list) object cannot be coerced to type 'double'
and
library(magrittr)
library(formattable)

iris_head <- iris %>% head()

iris_head %>% formattable(
  list(
    # area(row = 1, col = 1) ~ percent
    # ,
    area(row = 2, col = 2) ~ digits(., digits = 0)
    )
  )
throws the same error
Error in formattable(as.numeric(x), format = format, digits = digits,  :
  (list) object cannot be coerced to type 'double'
This reproducible example does not illustrate why I would want to do digit formatting to only one row of a column but for "Key : Value" like dataframes (2 columns, Key & Value), sometimes one or few of the Key's values warrants targeted formatting like this.
I think a named list would be more proper, but then I can not use the formattable package :)
Anyways, am I missing something? Am I writing this incorrectly? Do I need to create a function or wrap the code up in one of the other packages functions?
Thanks Patrick
You can write your own function
mydigits <- function(x) {
  digits(x, 0)
}


iris_head %>% formattable(
  list(
    area(row = 1, col = 1) ~ mydigits
  )
)
returns