formattable

formattable copied to clipboard
Centered Postive/Negative Bar Values
Looking for something like this: http://stackoverflow.com/questions/40781851/conditional-bipolar-inside-table-bar-chart-pandas-css
Possible to implement?
Great package! Thanks
you can use this. Its a bit ugly if you have many digits and if someone can get the numbers to align I would like to see that solution.
pm_color_bar <- function(color1 = "lightgreen", color2 = "pink", ...){
  formatter("span",
            style = function(x) style(
              display = "inline-block",
              float = ifelse(x >= 0, "right", "left"),
              "text-align" = ifelse(x >= 0, "right", "left"),
              "margin-left" = ifelse(x >= 0, "0%", "50%"),
              "margin-right" = ifelse(x >= 0,"50%", "0%"),
              "border-radius" = "4px",
              "background-color" = ifelse(x >= 0, color1, color2),
              width = percent(0.5*proportion(abs(as.numeric(x)), ...))
            ))
}
Thanks for the package :+1:
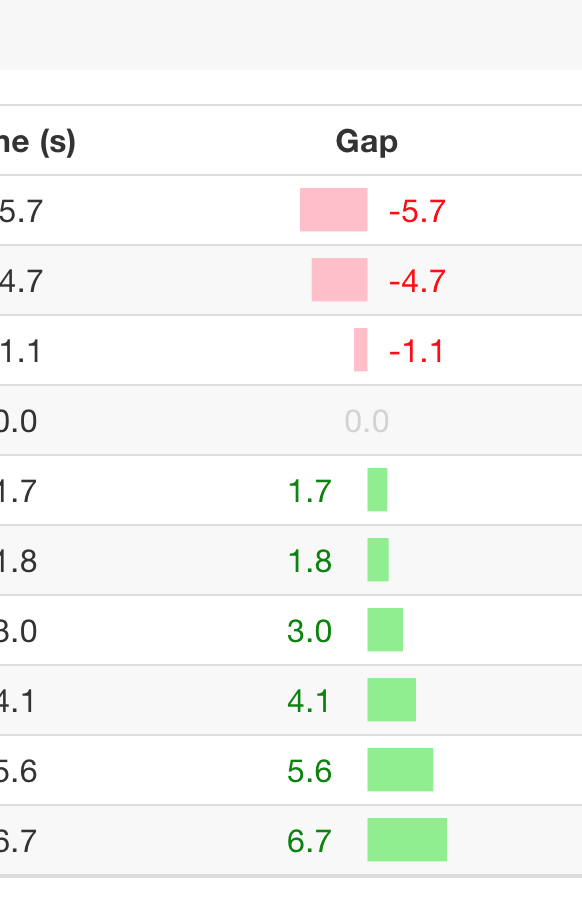
I started to explore this using CSS linear gradients:
bg = function(start, end, color, ...) {
  paste("linear-gradient(90deg,transparent ",percent(start),",",
        color, percent(start), ",", color, percent(end),
        ", transparent", percent(end),")")
}

pm_color_bar2 <- function(color1 = "lightgreen", color2 = "pink", ...){
  formatter("span",
            style = function(x) style(
              display = "inline-block",
              color = ifelse(x> 0,'green',ifelse(x<0,'red','lightgrey')),
              "text-align" = ifelse(x > 0, 'left', ifelse(x<0, 'right', 'center')),
              "width"='100%',
              "background" = bg(ifelse(x >= 0, 0.5,xnormalize(x)),
                                ifelse(x >= 0,xnormalize(x),0.5),
                                ifelse(x >= 0, color1, color2))
            ))
}
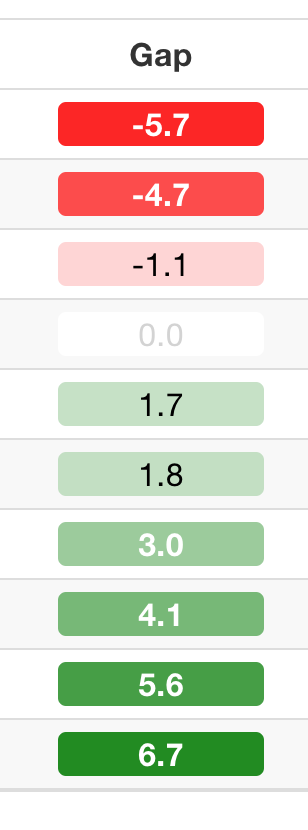
In passing, I also started to explore divergent cell backgrounds:
#https://stackoverflow.com/a/49887341/454773
color_tile2 <- function (...) {
  formatter("span", style = function(x) {
    style(display = "block",
          'text-align' = 'center',
          padding = "0 4px",
          `border-radius` = "4px",
          `font.weight` = ifelse(abs(x)> 0.3*max(x), "bold", "normal"),
          color = ifelse(abs(x)> 0.3*max(x),'white',
                         ifelse(x==0,'lightgrey','black')),
          `background-color` = csscolor(matrix(as.integer(colorRamp(...)(xnormalize(as.numeric(x)))),
                byrow=TRUE,
                dimnames=list(c("red","green","blue"), NULL),
                nrow=3)))
  })}

# Usage:
#formattable(rov_rebased_gap, align='c',
#            list(Gap = color_tile2(c("red",'white', "forestgreen"))))