regionmask

regionmask copied to clipboard
region fully contained?
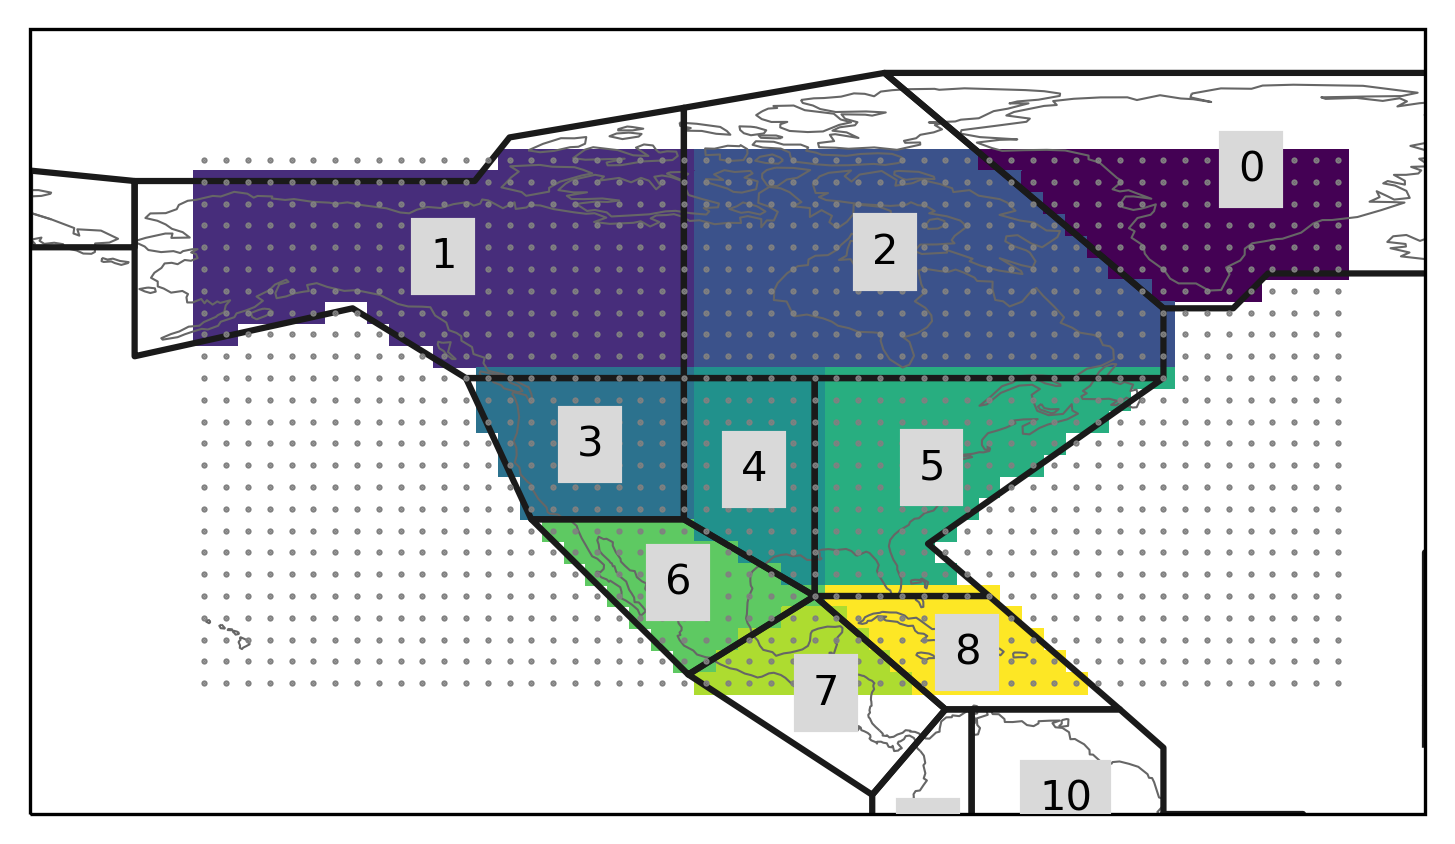
It could be nice to know which regions are fully contained within the grid. E.g. in the figure below that would be regions 3, 4, 5, and 6:
Proof of concept
Code
import regionmask
import shapely
import xarray as xr


def regions_contained(lon, lat, regions):

    # determine if the longitude needs to be wrapped
    regions_is_180 = regions.lon_180
    grid_is_180 = regionmask.core.utils._is_180(lon.min(), lon.max())

    wrap_lon = not regions_is_180 == grid_is_180

    lon_orig = lon.copy()
    if wrap_lon:
        lon = regionmask.core.utils._wrapAngle(lon, wrap_lon)

    lon = np.asarray(lon).squeeze()
    lat = np.asarray(lat).squeeze()

    if lon.ndim == 1 and lat.ndim == 1:
        poly = shapely.geometry.box(lon.min(), lat.min(), lon.max(), lat.max())

    # convex_hull is not really what we need
    # https://gist.github.com/dwyerk/10561690
    #     elif lon.ndim == 2 and lat.ndim == 2:
    #         # get the convex hull from all points
    #         lonlat = np.stack([lon.ravel(), lat.ravel()], axis=1)
    #         multipoint = shapely.geometry.MultiPoint(lonlat)
    #         poly = multipoint.convex_hull
    else:
        raise ValueError("Cannot currently handle 2D coordinates")

    fully_contained = list()
    for region_poly in regions.polygons:
        res = poly.contains(region_poly)

        fully_contained.append(res)

    return xr.DataArray(
        fully_contained, dims=["region"], coords=dict(region=regions.numbers)
    )
Example
# example regions and grid
ar6_land = regionmask.defined_regions.ar6.land
air = xr.tutorial.open_dataset("air_temperature")

lon = air.lon
lat = air.lat

cont = regions_contained(lon, lat, ar6_land)

print(cont.region.sel(region=cont))
Returns:
<xarray.DataArray 'region' (region: 4)>
array([3, 4, 5, 6])
Coordinates:
  * region   (region) int64 3 4 5 6
Caveats
- does not work for 2D coordinates
- Can return a wrong negative when the region is just slightly outside of the gridpoint (because the gridpoint center is used to determine the bounding box)
Code for plot
mask_3D = ar6_land.mask_3D(air)
regions = ar6_land

ax = ar6_land.plot()
regionmask.plot_3D_mask(mask_3D, add_colorbar=False)
ax.set_extent([-180, -20, 0, 90], ccrs.PlateCarree())

lon = regionmask.core.utils._wrapAngle(lon, True)
LON, LAT = np.meshgrid(lon, lat)
ax.plot(LON.ravel(), LAT.ravel(), ".", ms=1, color="0.5")

plt.savefig("test_region_contained.png", dpi=300, bbox_inches="tight")