Victory Charts with colorScale accept a list
Describe the bug A clear and concise description of what the bug is.
From the Victory Charts documentation: https://formidable.com/open-source/victory/docs/victory-pie/#colorscale
A colorScale can accept a string or a list of strings.
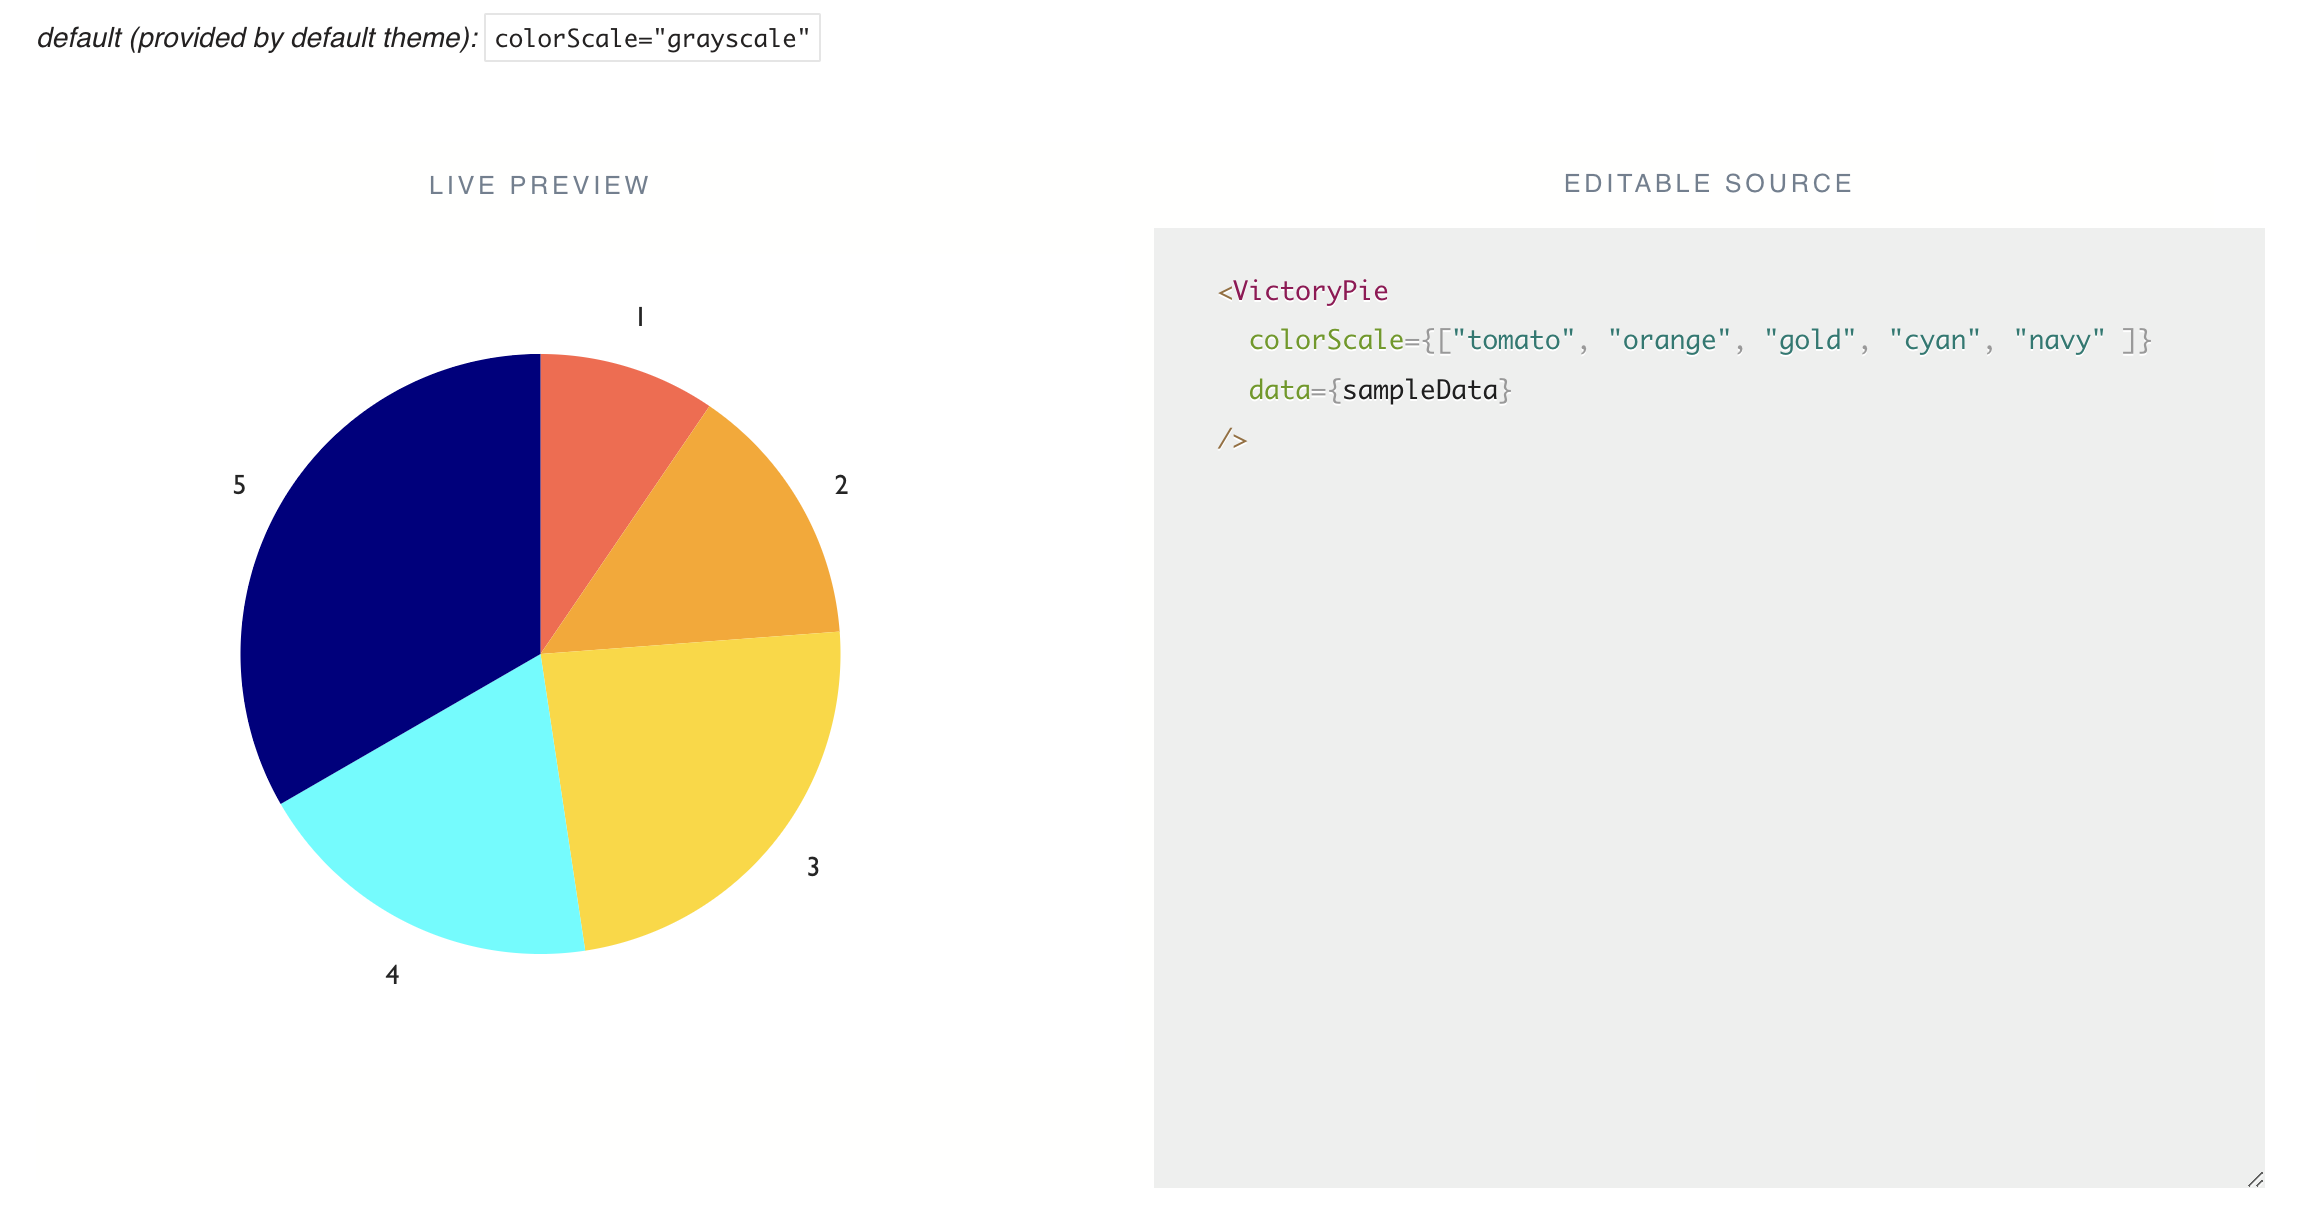
The colorScale prop defines a color scale to be applied to each slice of VictoryPie. This prop should be given as an array of CSS colors, or as a string corresponding to one of the built in color scales: "grayscale", "qualitative", "heatmap", "warm", "cool", "red", "green", "blue". VictoryPie will assign a color to each slice by index, unless they are explicitly specified in the data object. Colors will repeat when there are more slices than colors in the provided colorScale.
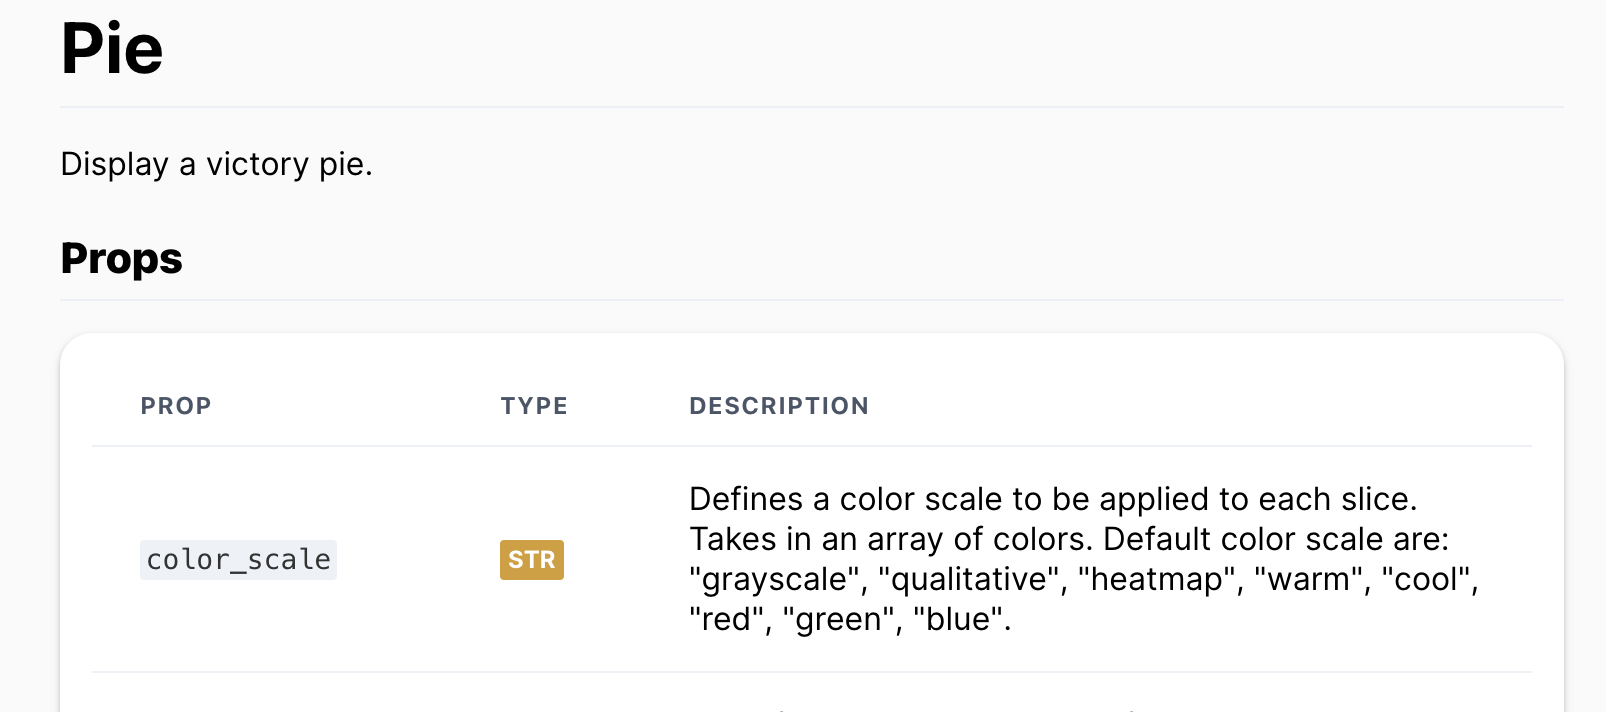
But currently the Examples for the Pie Charts show using a color_scale that is only a string.
https://pynecone.io/docs/library/graphing/pie#examples
To Reproduce Bad Example:
  pc.hstack(
      pc.pie(
          data=State.wl_data,
          color_scale="red, green",
      )
  ),
Bad Example:
  pc.hstack(
      pc.pie(
          data=State.wl_data,
          color_scale="[red, green]",
      )
  ),
Bad Example:
  pc.hstack(
      pc.pie(
          data=State.wl_data,
          color_scale="[red, green]",
      )
  ),
Bad Example:
  pc.hstack(
      pc.pie(
          data=State.wl_data,
          color_scale="[\"red\", \"green\"]",
      )
  ),
Settled for:
  pc.hstack(
      pc.pie(
          data=State.wl_data,
          color_scale="red",
      )
  ),
Which outputs:

Expected behavior A clear and concise description of what you expected to happen.
I expect an array of strings to be passed.