vscode-java
 vscode-java copied to clipboard
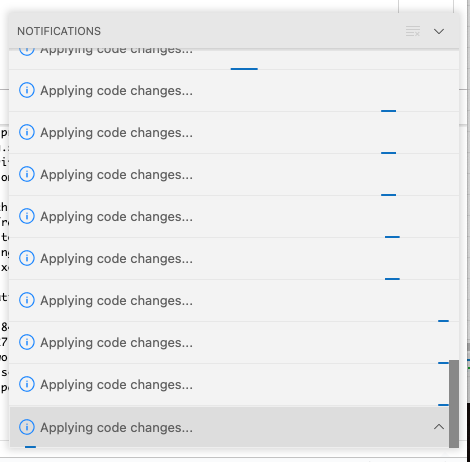
hot code replace set to auto causes endless "appyling code changes" notifications
Usually I use the "hode code replace" feature set to auto, so whenever I save the code is automatically injected into the running process. Since a few days this is not working as expected any more. As soon as I save, the functionality kicks in and the java LSP process goes crazy. It goes up to 200-300% CPU and never comes back. The problem seems to be that the "Applying code changes ..." functionality is repeatedly started over and over again, but seems to never stop. It does not recover on its own, I have to restart vscode.
Environment
- Operating System: macOS 11.6.2 (20G314)
- JDK version:openjdk 17.0.1 2021-10-19
- Visual Studio Code version: 1.65.1
- Java extension version: v0.22.0
Steps To Reproduce
- Set "Hot code replace" to
auto - Halt on breakpoint
- Change code and save a few times in a row
After a few times it looks like this: The log contains proprietary code, so I cannot easily share it here. But it seems fine, no repeating (error) messages of any kind. Just the change detection seems to kick in repeatedly and invoke the "hot code replace" every time (which never returns).
Current Result
"Applying code changes" goes crazy.
Expected Result
Apply codes changes. Java LSP process should permanently consume 200-300% CPU after it.
Additional Informations
If I use the manual "hot code replace" (the lightning symbol), I can't reproduce the issue.
The error itself, and functionality is coming from https://github.com/microsoft/vscode-java-debug/ . Closest issue I found there was https://github.com/microsoft/vscode-java-debug/issues/1039 .
@testforstephen , is there some change on the vscode-java end that would affect https://github.com/microsoft/vscode-java-debug/ ?
Update : Tried with : VS Code 1.65.1 (On Linux), redhat.java 1.4.0, vscjava.vscode-java-debug 0.38.0 (these should be the latest from the Java extension pack (0.22.0). I don't see it happening even with "java.debug.settings.hotCodeReplace": "auto", but I can try more closely to the reported case.
The Java Debugger's hot reload feature depends on the build job from vscode-java.
The debugger registers a listener ResourcesPlugin.getWorkspace().addResourceChangeListener(classChangeListener, IResourceChangeEvent.POST_BUILD) to monitor build changes and apply them automatically if it's auto mode.
See the issue https://github.com/microsoft/vscode-java-debug/issues/1131, it also mentioned that VS Code Java compiles all the time when save, is there any build behavior change on the upstream JDT? @rgrunber
Could not reproduce on linux with redhat.java 1.4.0, seems to only affect mac users in my team (no Windows users)
Will the next version include a fix. This is really annoying. Something in the code changed and broke. It should be fixed by now, imho, it's over a month ago. Just sticking with an old version (1.3.0 of the language server) is not an option over the long term.
@rgrunber @testforstephen All of us in the development department have had this problem for over a month.
- The steps to reproduce this problem are, after starting debugging, open any java file and save it more than three times in quick succession (Ctrl + S), which will cause all the code of the current project to be recompiled!
We’re also experiencing this issue when using Gradle and setting "java.debug.settings.hotCodeReplace" to "auto".
| Component | Version |
|---|---|
| OS | macOS 15.4.1 (24E263) |
| VS Code | 1.99.3 |
| Language Support for Java | 1.41.1 |
| Debugger for Java | 0.58.2 |
| Gradle for Java | 3.16.4 |
Still have this issue on the last version (1.42.0).
I used to downgrade to 1.39 because it was working but now I don't know why is not working on any version.
make sure you also downgrade the java debugger extension, which is actually responsible for this issue
This issue has been open for over three years, which makes me lose hope for a solution :/
I was happy to not have this bug on a fresh project and was actually enjoying uneventful hot reloading for a few days. Then VS Code updated to May 2025 (Version 1.101) and now it’s back.
This is infuriating. Not only does it endlessly try to apply changes, it also seems to act as a sort of fork bomb, spawning like 50 java processes all stumbling over each other.
Wrote a comment with proof of the insane resource use on https://github.com/microsoft/vscode-java-debug/issues/1131 — the issue is the only of its kind over there and hasn’t had activity since 2022. What a mess.
My system:
| Component | Version |
|---|---|
| OS | Windows 11 Enterprise 24H2 (Windows_NT x64 10.0.26100) |
| VS Code | 1.104.1 |
| Language Support for Java | 1.46 |
| Debugger for Java | 0.58.2 |
| Gradle for Java | 3.17.0 |
Setting "java.debug.settings.hotCodeReplace" to "manual" or "never" in the Workspace environment worked for me. In User and Remote [WSL} environment "auto" seems to be no problem. At least I could debug again. Well, if you really want to have "auto" it is annoying, but maybe somebody who reads this doesn't need it and has trouble with this setting.
I have the same behavior here:
Version: 1.104.3 Commit: 385651c938df8a906869babee516bffd0ddb9829 Date: 2025-10-02T12:30:51.747Z Electron: 37.3.1 ElectronBuildId: 12404162 Chromium: 138.0.7204.235 Node.js: 22.18.0 V8: 13.8.258.31-electron.0 OS: Linux x64 6.8.0-83-generic
Debugger for Java: 0.58.2 Language Support for Java: 1.46.0