Chart renders incorrectly when using StackedAreaChart with brush and zoom
I'm submitting a...
[ ] Regression (a behavior that used to work and stopped working in a new release)
[x] Bug report
[ ] Performance issue
[ ] Feature request
[ ] Documentation issue or request
[ ] Other... Please describe:
Current behavior
I constructed this demo using a few examples from the stories, and I have the following issues:
-
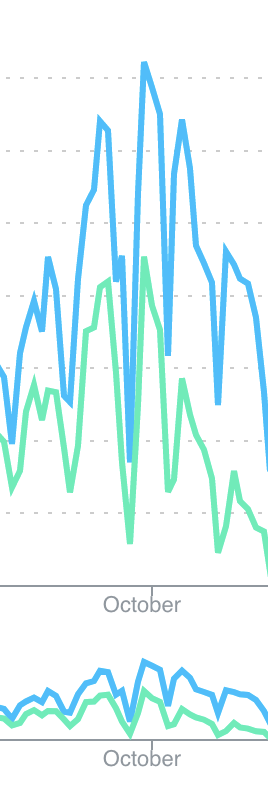
When changing the range, the chart lines are being rendered incorrectly.
-
The same exact chart looks different between the brush and the large chart. Is that because of the different heights?
Minimal reproduction of the problem with instructions
https://stackblitz.com/edit/react-reaviz
- Use the chart brush to shorten the range
- Scroll to the right.
(The codesandbox link is not working)
Environment
Libs:
- react version: 17.0.1
- reaviz version: 9.3.14

Browser:
- [x] Chrome (desktop) version 86.0.4240.198
- [ ] Chrome (Android) version XX
- [ ] Chrome (iOS) version XX
- [ ] Firefox version XX
- [ ] Safari (desktop) version XX
- [ ] Safari (iOS) version XX
- [ ] IE version XX
- [ ] Edge version XX

For Tooling issues:
- Node version: v12.18.3
- Platform:  Mac
Oh - that is fun.
This is general area where this is happening: https://github.com/reaviz/reaviz/blob/master/src/AreaChart/AreaSeries/Line.tsx#L154
IF you turn off animations does it work?
Thanks for the quick response!
I tried disabling the animation for the Series and Line, the drawing is faster but the bug still happens. I will try to debug this method tomorrow.
So I have found out that the issue starts here: https://github.com/reaviz/reaviz/blob/master/src/AreaChart/AreaSeries/Line.tsx#L102
I tried different approaches that fix this issue:
-
Changing the condition in https://github.com/reaviz/reaviz/blob/master/src/AreaChart/AreaSeries/Line.tsx#L102:
if ( this.ghostPathRef.current && (prevProps.data !== this.props.data || prevProps.width !== this.props.width || prevProps.xScale !== this.props.xScale || prevProps.yScale !== this.props.yScale) ) {} -
Spreading the
dataarray in https://github.com/reaviz/reaviz/blob/master/src/AreaChart/AreaSeries/AreaSeries.tsx#L182 and https://github.com/reaviz/reaviz/blob/master/src/AreaChart/AreaSeries/AreaSeries.tsx#L197:-data={data} +data={[...data]} -
Using the state in my component instead of the imported data and spreading the
dataarray.
I'm no React expert but I think that if one of the solutions directly in the reaviz code is fine, it should be applied in a lot of places in the different charts, and I have no problem opening a PR.
I went with the first solution. Let me know if you want me to create a story for this scenrio.