react-chartjs-2
 react-chartjs-2 copied to clipboard
Line Graph loses data on duplicate labels
I think I found an interesting bug, but hopefully there is an explanation and a fix. Below are my datasets and my component. I have also provided the source code for the component at the bottom of this issue.
EDIT: It seems that this 'bug' only occurs when there are duplicate labels. For whatever reason the library will display them on the first render but upon re-render it either ignores or drops the latter duplicate label and it's data.
const lineGraphData = {
  labels: [1500, 1600, 1700, 1750, 1800, 1850, 1900, 1950, 2000, 2050],
  datasets: [
    {
      data: [86, 114, 106, 106, 107, 111, 133, 221, 783, 2478],
      label: 'Africa'
    },
    {
      data: [282, 350, 411, 502, 635, 809, 947, 1402, 3700, 5267],
      label: 'Asia'
    },
    {
      data: [168, 170, 178, 190, 203, 276, 408, 547, 675, 734],
      label: 'Europe'
    },
    {
      data: [40, 20, 10, 16, 24, 38, 74, 167, 508, 784],
      label: 'Latin America'
    },
    {
      data: [6, 3, 2, 2, 7, 26, 82, 172, 312, 433],
      label: 'North America'
    },
    {
      data: [44, 30, 60, 26, 25, 39, 79, 110, 508, 784],
      label: 'Latin America'
    }
  ]
}
<ChartsGraphs
        type="line"
        data={lineGraphData}
        height={250}
        width={1000}
        options={{
          title: {
            display: true,
            text: 'World population per region (in millions)'
          }
        }}
      />
So this part of a storybook that shows examples of different type of charts and graphs you can use with the component I built off of this library. What's interesting is that when the page loads, all of my datasets are present and load correctly in the line graph. When I switch to a bar graph or a pie graph in the storybook and then switch back to the line graph I begin losing data. Below are some before and after images.
On page load:
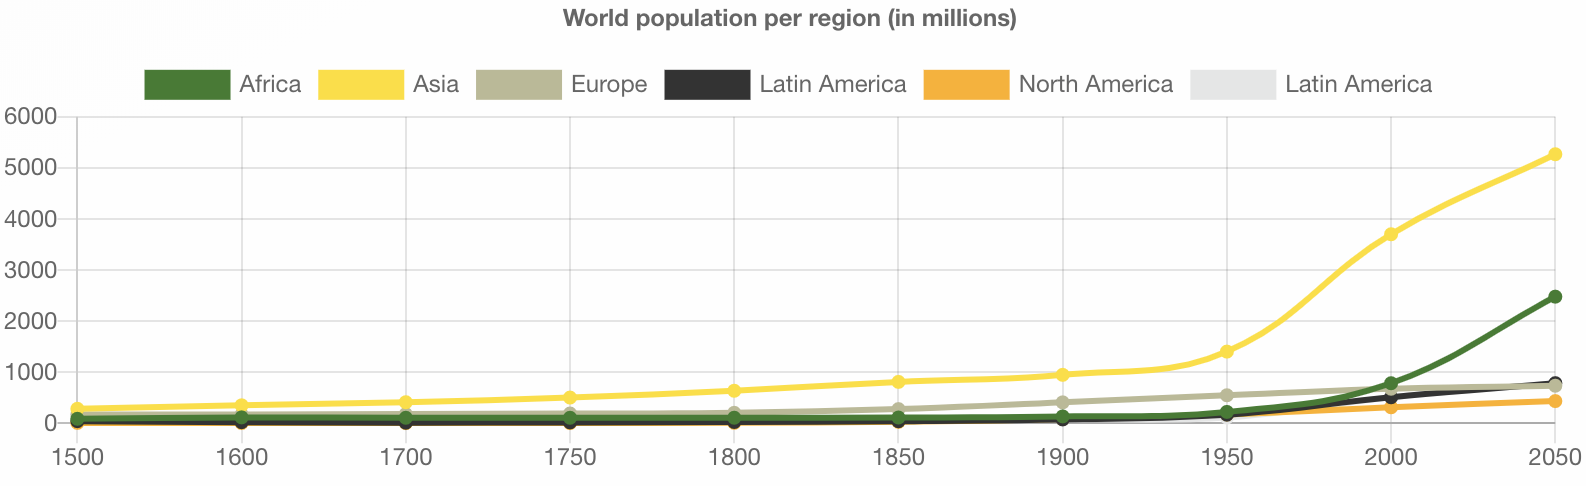 After switching between stories:
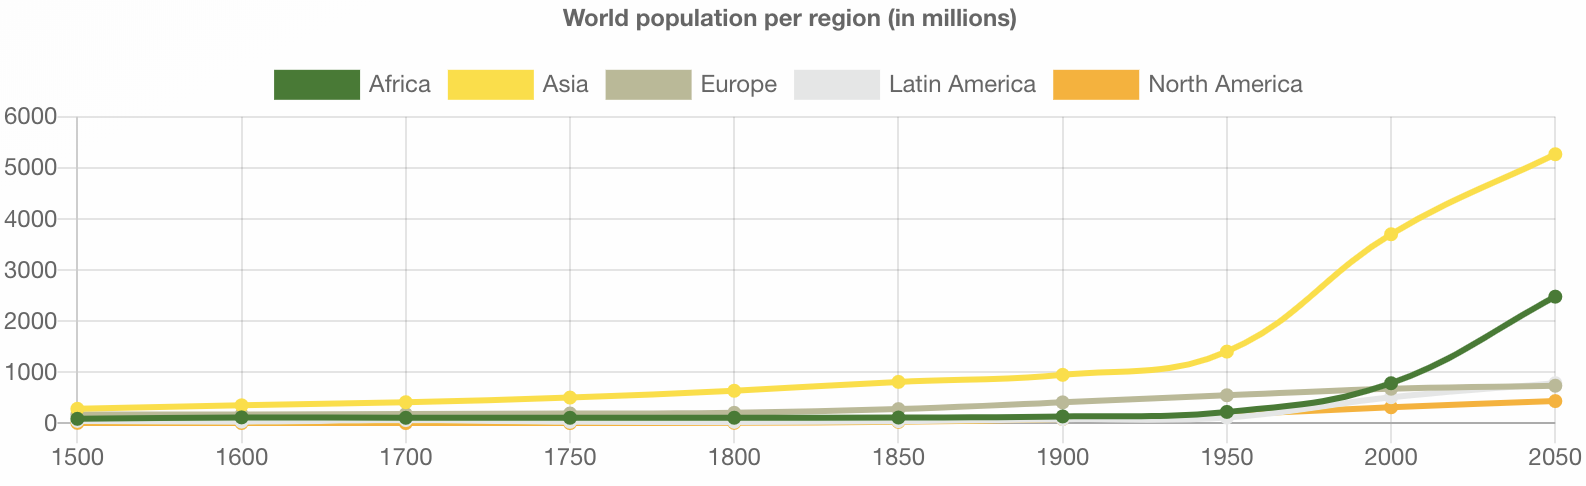
You'll notice I lose the second Latin America dataset. At first I thought it was because I had simply duplicated the datasets to test how more datasets were handled with my component, but after changing the data I find the issue remains. Has anyone else encountered this issue?
Component source code:
import React from 'react';
import PropTypes from 'prop-types';
import { Bar, Line, Pie } from 'react-chartjs-2';
import { defaults } from 'react-chartjs-2';

// Set defaults.
defaults.global.responsive = true;
defaults.global.maintainAspectRatio = false;

const colors = [
  '#367C2B',
  '#FFDE00',
  '#BAB994',
  '#333333',
  '#FFB000',
  '#E5E6E6',
  '#717A80',
  '#FFF494',
  '#A3AE58'
];

const typeCheck = o => typeof o !== 'undefined' && o !== null;

export const ChartsGraphs = props => {
  const dataType = {
    bar: () => {
      const data =
        props.data.datasets &&
        props.data.datasets.map(dataset => {
            !typeCheck(dataset.backgroundColor) &&
            (dataset.backgroundColor = colors)
        })

      let options = props.options &&
        typeof props.options === 'object' && { ...props.options }

      typeCheck(props.legend) &&
        /* this type check insures there is not a legend and is not displayed */
        (props.legend.display = false)

      return (
        <div className="position-relative">
          <Bar data={data} options={options} {...props} />
        </div>
      )
    },
    line: () => {
      let colorIndex = 0

      const data =
        props.data.datasets &&
        props.data.datasets.map(dataset => {
          let incrementBrandColor = false

          if (!dataset.borderColor) {
            dataset.borderColor = colors[colorIndex]
            incrementBrandColor = true
          }

          if (!dataset.backgroundColor) {
            dataset.backgroundColor = colors[colorIndex]
            incrementBrandColor = true
          }

          !dataset.fill && (dataset.fill = false)
          incrementBrandColor &&
            (colorIndex = colors[colorIndex + 1] ? colorIndex + 1 : 0)
        })

      return (
        <div className="position-relative">
          <Line data={data} {...props} />
        </div>
      )
    },
    pie: () => {
      const data =
        props.data.datasets &&
        props.data.datasets.map(
          dataset =>
            (dataset.backgroundColor === undefined ||
              dataset.backgroundColor === null) &&
            (dataset.backgroundColor = colors)
        )

      return (
        <div className="position-relative">
          <Pie data={data} {...props} />
        </div>
      )
    }
  };

  const Component = dataType[props.type];

  return <Component />;
};

ChartsGraphs.propTypes = {
  data: PropTypes.object.isRequired,
  options: PropTypes.object
};
Relevant information: "chart.js": "^2.7.3", "react-chartjs-2": "^2.7.4", "react": "^16.6.1", "react-dom": "^16.6.1", "@storybook/react": "4.1.18"
I ran into the same problem since my labels were generated as the result of a numerical computation and so could be duplicates after the numbers were rounded. I solved it by adding my own datasetKeyProvider prop. See documentation: https://github.com/jerairrest/react-chartjs-2#working-with-multiple-datasets.
I defined a datasetKeyProvider function where the key is a unique string that had been added to each dataset (along with the labels that may not be unique). The keys I used for each line were simply 'L1', 'L2',... etc.
getIndexAsKey = (d) => {return d.key};
Then I added a datasetKeyProvider prop that referenced the function:
<Line
    datasetKeyProvider={this.getIndexAsKey}
    options={options}
    data={chartData}
/>