Memory leak in stack navigator
Current Behavior
- What code are you running and what is happening?
Android memory consumption is increasing as pages are pushed onto the stack, but memory is not release when navigation.popToTop or navigation.reset are used. Memory consumption increase is visible via
adb shell dumpsys meminfo [project]. Memory increase can also be seen on device via system settings at a much less granular level.
Edit: this issue also occurs on iOS, see follow up comments
Expected Behavior
- What do you expect should be happening? Memory should be released when stack is cleared using popToTop or reset.
How to reproduce
I am able to see this issue using the example code from https://reactnavigation.org/docs/en/tab-based-navigation.html#a-stack-navigator-for-each-tab. I've also created a repo to demonstrate this based off that example: https://github.com/kaplantm/react-navigation-android-leak-example
I've provided the minimal example to see this issue, but in more complex apps, with enough pages pushed onto the stack (over 100, not at the same time - there are resets every 20 pages, so no more than 20 are mounted at a time) the app will eventually hit a memory limit.
Your Environment
I've observed this happening while using react-navigation versions 2.18.3 (w/ react-native 0.57.7) and 3.11.0 (w. react-native 0.59.9).
| software | version |
|---|---|
| react-navigation | 3.11.0 or 2.18.3 |
| react-native | 0.59.9 or 0.57.7 |
| node | 8.11.4 |
| npm or yarn | npm 6.4.1 |
@satya164 I wasn't sure how to create a project using a specific version of react-navigation-stack. I tried to download and run the source from https://github.com/react-navigation/stack/releases/tag/v2.0.0-alpha.2 but ran into hast map errors (duplicate module safe-area-view). I pulled the master branch of https://github.com/react-navigation/stack repo and tested using that. If this isn't what you meant, please give instructions on how to test this with the latest alpha version and I'll give that a try.
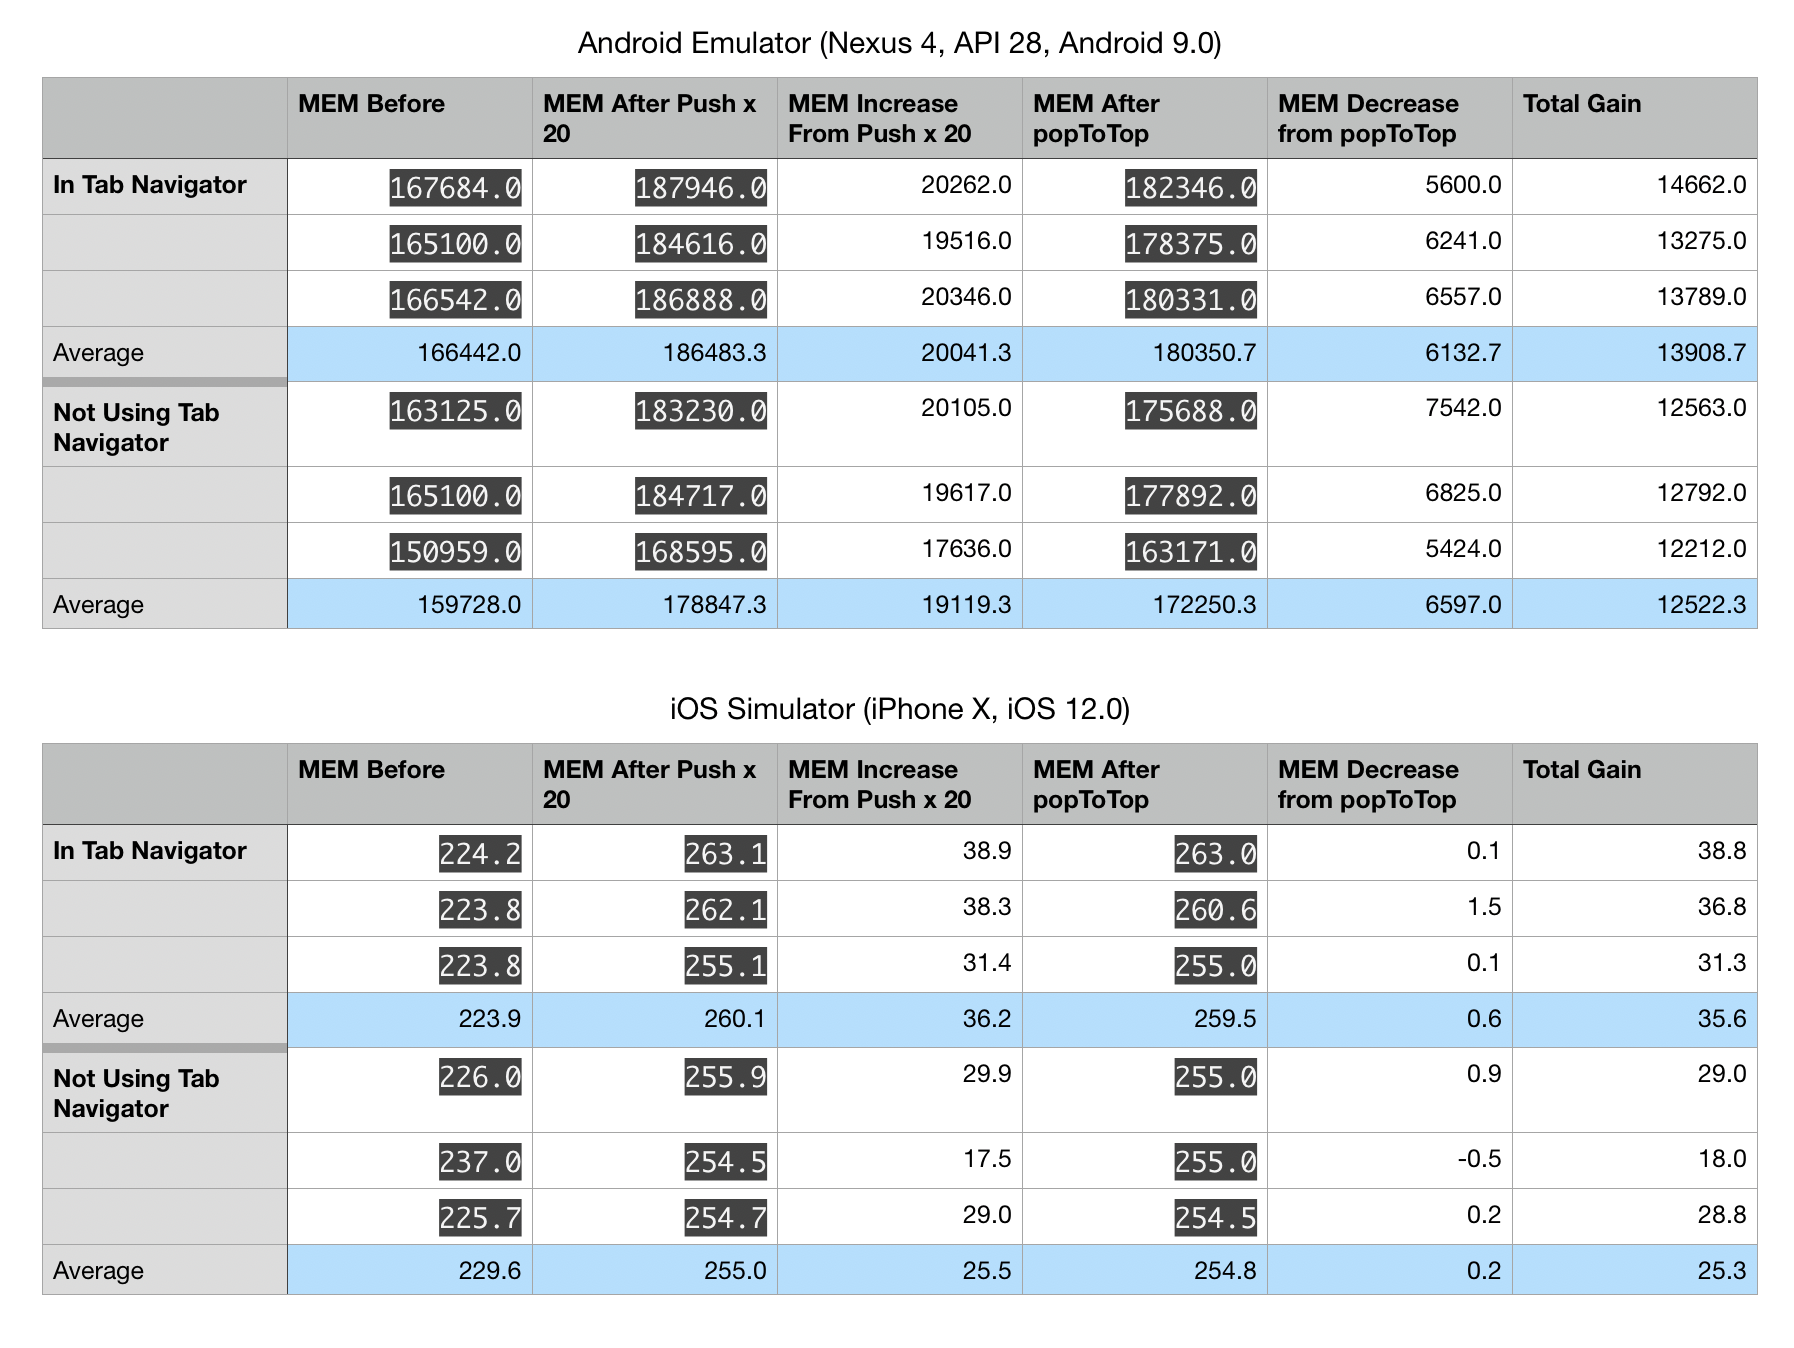
Based on my tests, this issue is still evident. I also collected data on iOS, and memory is not released there either.
I modified the simple example slightly to always push the Details screen (instead of using navigate). I noted the memory usage three times (Each time I waited a few seconds to get a stable reading.).:
- After selecting "Simple" on the first screen.
- After pushing 20 new instances of the details screen onto the stack.
- After calling popToTop
For the android emulator I collected memory information using a custom script that runs adb shell dumpsys meminfo host.exp.exponent every half second and prints the average of the last three values.
For the iOS simulator I noted the RAM via the performance monitor in the simulator (via expo).
Here are my findings:
I was able to get the v2.0.0-alpha.2 release running. I'm still seeing the same issue, and this version seems to actually be using more memory. This time I only tested the stackNavigator (not wrapped in a tabNavigator) since that didn't seem to effect it (in either release).

if you run this with dev mode disabled can you reproduce the same issue?
Yes, here is the production mode data:

Our QA team has also seen this issue on-device when looking at memory usage for apps built in release mode (via the android developer menu in device settings).
@kaplantm can you try again with latest version of react-navigation-stack?
I tested using Release 2.0.0-alpha.5. Here are the results:
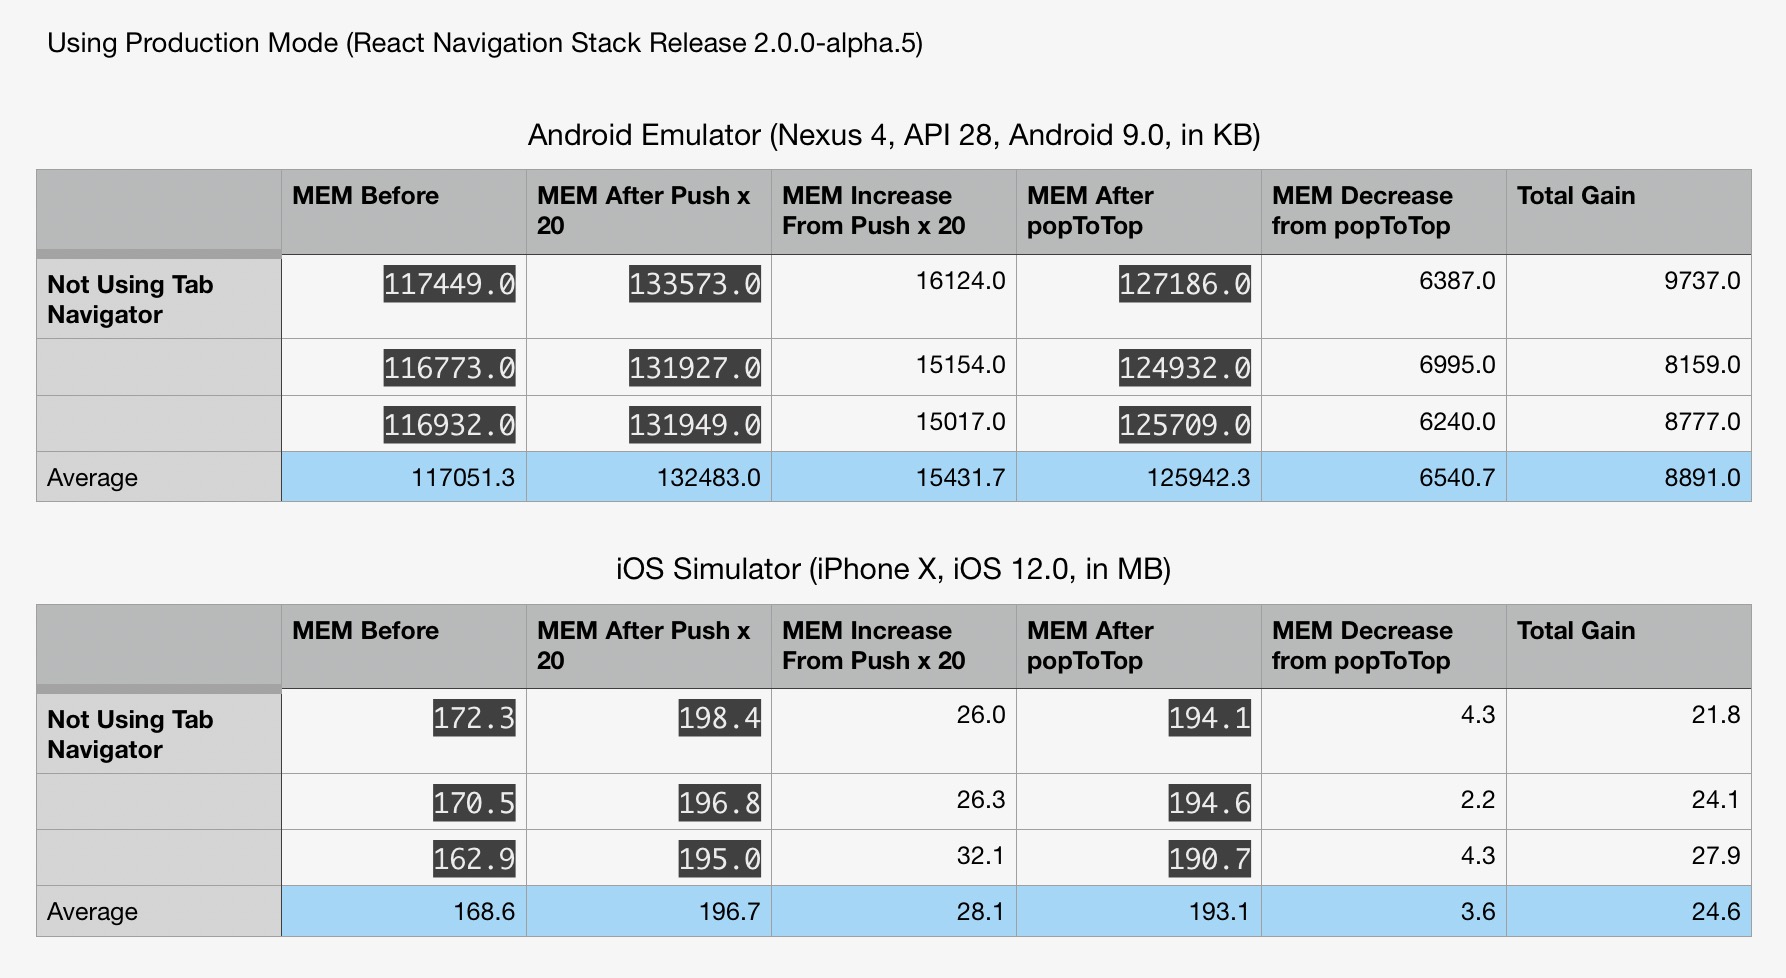 They appear similar to the previous master branch data, with iOS being a little higher than before. For us, we haven't seen out-of-memory errors on iOS, so android and our major concern.
I've been using this script to get memory data on Android, and for iOS I've just been using the developer menu in the simulator to show memory consumption.
I've been using the example app in react-navigation-stack. I've modified it slightly, replacing Buttons in SimpleStack.js with the following:
const Buttons = withNavigation(props => (
  <React.Fragment>
    <Button
      title="Push Details"
      onPress={() => props.navigation.push('Details')}
    />
    <Button title="PopToTop" onPress={() => props.navigation.popToTop()} />
  </React.Fragment>
));
This has been my procedure for recording memory usage (Assumptions: Expo is set to use production mode. You've opened the app via Expo before, and you already have the Android memory script running or iOS perf monitor enabled):
- Open Expo from closed.
- Select current project from recently opened.
- Click "Simple".
- Wait about a minute for memory to stabilize. Record memory as "MEM Before"
- Click "Push Details" 20 times.
- Wait about a minute for memory to stabilize. Record memory as "MEM After Push x 20".
- Click PopToTop.
- Wait about a minute for memory to stabilize. Record memory as "MEM After popToTop".
- Close app/expo
Iam also getting memory leak with basic app:

Memory starts on 110mb --- after few actions (Open screen / back to home) memory rise to aroun 150mb. After 1 minute memory cool down to around 140...but there is still somewhere that 30mb.
:( EDIT: On ios --- not tested on android..but i think it would be same becouse complex app somebody crash on Android and i think it has something to do with react-navigation memory leaks.
"react-navigation": "^3.11.1",
This is also a major problem for my team, as our page is complicated,switch tabs many times may crash the APP.
Same issue here. RAM keeps increasing without release everytime new screen is being openned. Sooner or later OOM termination happens. Occurs both on android & iOS. We use combination of tab and stack navigators.
"react-navigation": "^3.11.1", "react-native": "0.60.4", "react": "16.8.6",
i have the same issue "react": "16.8.3", "react-native": "0.59.10", "react-navigation": "^3.11.0", "react-native-gesture-handler": "1.3.0" here is my demo: https://github.com/wv1124/react-native-router-flux-test/tree/react-navigation-test
also can you post the script you're using to collect memory usage info?
you can try : while sleep 5; do adb shell dumpsys meminfo com.xxxx | grep Unknown; done
replace com.xxxx to your package
Has anyone got any lead on this or alternative to solve the issue? We have got an escalation in our project due to this.
Hello 👋, this issue has been open for more than 2 months with no activity on it. If the issue is still present in the latest version, please leave a comment within 7 days to keep it open, otherwise it will be closed automatically. If you found a solution on workaround for the issue, please comment here for others to find. If this issue is critical for you, please consider sending a pull request to fix the issue.
Ping on this. We're seeing iOS behavior similar to what @kaplantm described. Do we have leads on the root cause or on a fix?
We're on react-native-navigation 3.11.1, react-navigation-stack 1.40.
this is likely still an active and significant problem. please consider re-opening this.
bump, having issues with our stack & tab-navigator heavy app on iOS slowing down like crazy after a bit of navigation
Any updates on this? Seeing this exact issue. The createStackNavigation docs do not specify if screens are unmounted or not, while createBottomTabNavigator has a lazy: true for first render of tabs, plus unmountOnBlur to unmount them.
I'm still using React -navigation in 1.6.1,I found that when I upgraded React -navigation to V5, I encountered a memory leak
I see this issue on my app with [email protected] As my investigation:
- Open HomePage: 100MB
- Open ArticleDetailPage: +30MB (130MB)
- Back to HomePage: -20MB (120MB)
- Open ArticleDetailPage: 130MB
- Back to HomePage: 120MB
- Open some other pages: Memory increases... If you use your big app (with so many different screen), mem can be inc to > 500MBs, never cool down to 200MB
There was something ~20MB cached when you mounting a page, I think it relates to lazy-loading of the React components, when it was mounted to memory, it lives there until the app was kill & restarted. Restart the JS thread do not release that memory.
FYI, I used _navigator.dispatch(NavigationActions.navigate(opt)) and .goBack(), tried _navigator.dispatch(StackActions.popToTop()) got same behavior.
Is this related to react-core + how we load our code? I don't have experience in native development so I cannot jump into a conclusion!
Moving my suggestion from #7686 to this issue
We have a project where user can navigate through virtual artworks, each screen have lots of images and the design side implement a shortcut for search through it.
Our flow look like this: home -> search -> choose search result -> view result -> click shortcut for search -> search -> choose search result -> view result.
It looks like react-navigation doesn't clear if the same screen was open. We have tried to use each navigation method like direct navigation with navigator.navigate or pop screens.
Our data leaks rapidly going to gigabytes with this navigation flow which was unacceptable and we moved out from the react-navigation library and just implemented all the navigation with redux and big "if" statement in the app.js (which is ugly, but it works without any leaks)
update: 20.01.2021 It looks like react-navigation supports only finite automata for navigation, but if you have cycles in your navigation graph then it means you will be unavailable to use the library, am I right? This behavior should be documented in limitations or fixed in my opinion.
I was also experiencing this issue. I've found a possible solution to import enableScreens from react-native-screens and call enableScreens() in my App.js component before my app (and, therefore, my Navigation component) renders.
I tried as @rchristian said, but it seems it only improves a litter, this is not the solution to solve this problem.
Does any of you guys think this issue is related to https://github.com/software-mansion/react-native-screens/issues/843 ? 😕
Has there been any offical comments to this? I have the same issue with memory increasing when navigating the stack.
I can help with an idea or a little bunch of the code if the team or significant developers from the team will give some feedback on it.
It's hard to find the source of the issue in 3rd party code. It can take ages to find where required logic lays.