react-financial-charts
 react-financial-charts copied to clipboard
Published
20 hours ago •
 react-financial
[Feature] How to render footprint chart?
I'm submitting a...
- [ ] bug
- [x] feature
- [ ] chore
What is the current behavior
First thank you all for making this wonderful library. We have a question about using this library.
Does this lib support rendering footprint chart? If not, any suggestions on where to start implementing by myself?
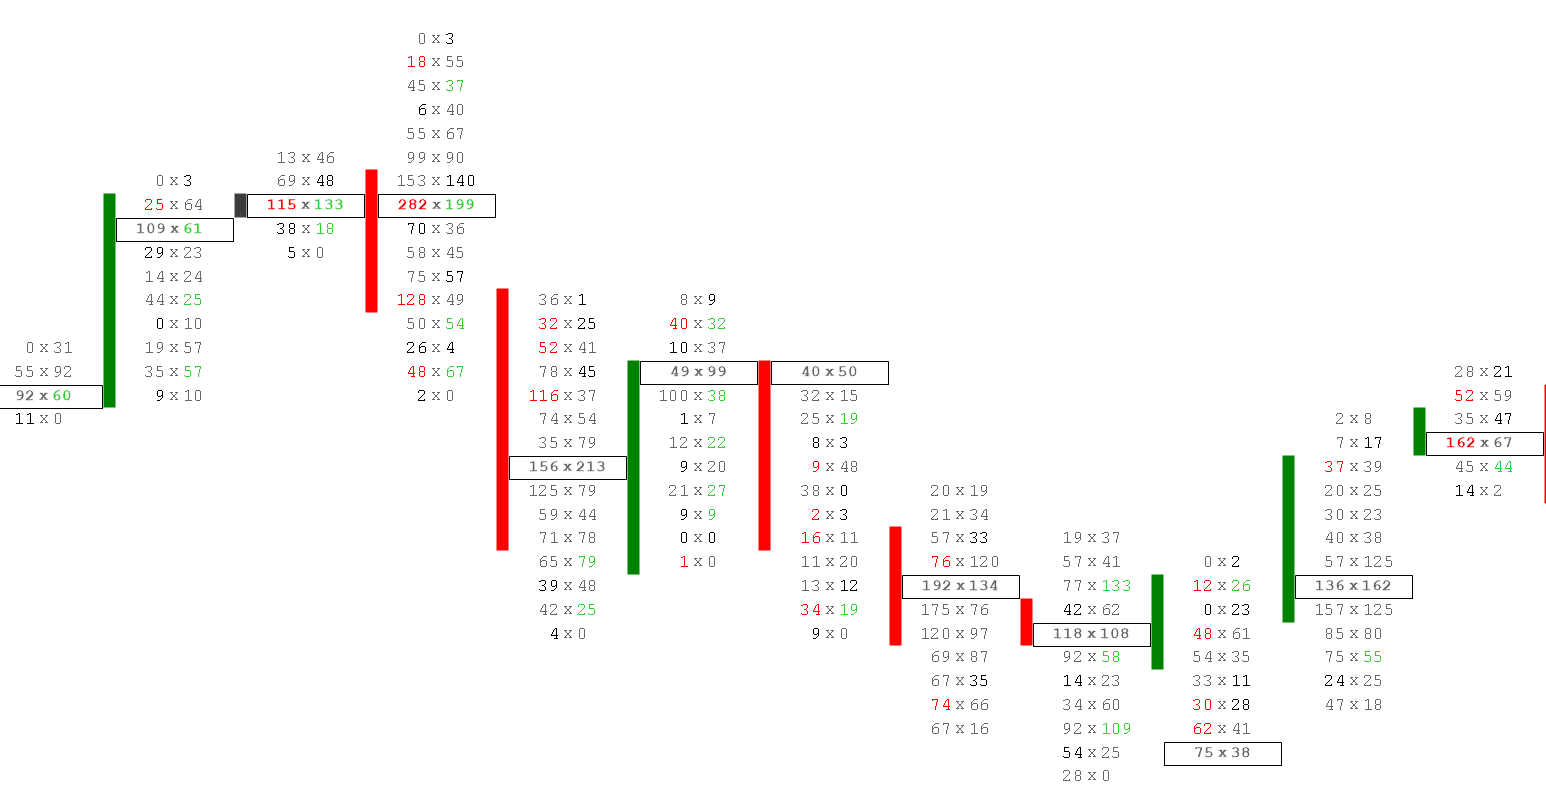
Some info about footprint chart:
Footprint charts are a type of candlestick chart that provides additional information, such as trade volume and order flow, in addition to price. It is multi-dimensional in nature, and can provide an investor with more information for analysis, beyond just the security's price.
Sample picture:
Please tell us about your environment
- Version: 1.3.3
- Browser: all