Lables of checkerboard plot in example of mcnemar_table do not match the documentation
Describe the documentation issue
https://rasbt.github.io/mlxtend/user_guide/evaluate/mcnemar_table/#example-2-2x2-contingency-table
The labels of the checkerboard plot do not seem to match the description of the returned value

tb is
array([[4, 1],
       [2, 3]])
from returns in https://rasbt.github.io/mlxtend/user_guide/evaluate/mcnemar_table/#api
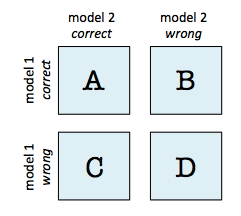
2x2 contingency table with the following contents: a: tb[0, 0]: # of samples that both models predicted correctly b: tb[0, 1]: # of samples that model 1 got right and model 2 got wrong c: tb[1, 0]: # of samples that model 2 got right and model 1 got wrong d: tb[1, 1]: # of samples that both models predicted incorrectly
- 4 (
tb[0, 0], a) is # of samples that model 1 and 2 got right - 1 (
tb[0, 1], b) is # of samples that model 1 got right and model 2 got wrong - 2 (
tb[1, 0], c) is # of samples that model 2 got right and model 1 got wrong - 3 (
tb[1, 1], d) is # of samples that model 1 and 2 got wrong
Suggest a potential improvement or addition
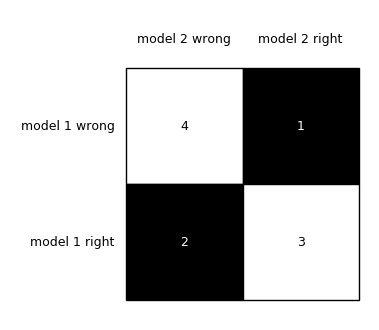
I think that reversing each labels will work.
brd = checkerboard_plot(tb,
                        figsize=(3, 3),
                        fmt='%d',
                        col_labels=['model 2 right', 'model 2 wrong'],  # As is: ['model 2 wrong', 'model 2 right']
                        row_labels=['model 1 right', 'model 1 wrong'])  # As is: ['model 1 wrong', 'model 1 right']
@rasbt: I just wanted to chime in and confirm @ftnext's findings here (as well as those on his other issue, i.e., #988). The documentation is inconsistent in terms of which side of the table are labeled as model1 vs. model2 and correct vs. incorrect. Based on the current implementation, the documentation examples generally do not reflect things accurately given the current mlxtend code (as of Dec 2024).
Specifically, for the following code:
import numpy as np
from mlxtend.evaluate import mcnemar_table

# The correct target (class) labels
y_target = np.array([0, 0, 0, 0, 0, 1, 1, 1, 1, 1])

# Class labels predicted by model 1
y_model1 = np.array([0, 1, 0, 0, 0, 1, 1, 0, 0, 0])

# Class labels predicted by model 2
y_model2 = np.array([0, 0, 1, 1, 0, 1, 1, 0, 0, 0])

tb = mcnemar_table(y_target=y_target,
                   y_model1=y_model1,
                   y_model2=y_model2)

print(tb)
The documentation claims output of:
[[4 1]
 [2 3]]
When in reality you get:
[[4 2]
 [1 3]]
In reality, the truth for this example ought to be:
# both correct: 4
# both incorrect: 3
# only m1 correct: 2
# only m2 correct: 1

#    m2c  m2i
# m1c  4    2
# m1i  1    3
I believe these issues cropped up with some older revisions, i.e., #664 and #744.
Thankfully, none of this affects test results, but the following documentation pages need to be cleaned up since they lead to confusion:
- https://rasbt.github.io/mlxtend/user_guide/evaluate/mcnemar_table/#example-2-2x2-contingency-table
- https://rasbt.github.io/mlxtend/user_guide/evaluate/mcnemar/
For the examples in the documentation to be correct, all tables should follow this format (as in the first example of the second link above):
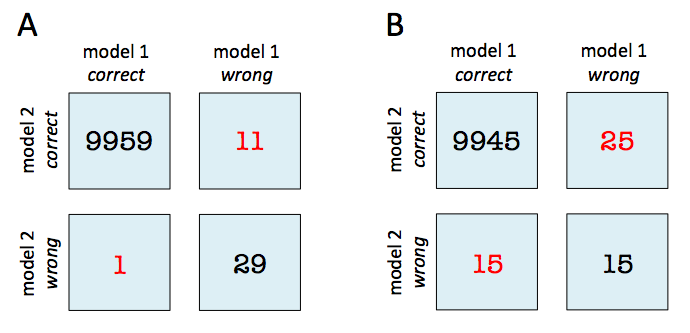
However, notice that the subsequent examples use the wrong labels:
Finally, as @ftnext points out, this example is simply wrong in terms of its labels compared to the ground truth (i.e., if the figure below were correct, the bottom right corner ought to be 4 -- the labels here really should be reversed):
Thanks for the note, I appreciate it. I am currently out with an injury but will bookmark this and revisit it in the upcoming weeks.
Thanks for the note, I appreciate it. I am currently out with an injury but will bookmark this and revisit it in the upcoming weeks.
Wishing you a quick recovery!