mlxtend

mlxtend copied to clipboard
plot_decision_regions: allow arbitrary class labels
Please note that this functions assumes that class labels are labeled consecutively, e.g,. 0, 1, 2, 3, 4, and 5
Would it be much effort to remove that restriction? I just wondered why my testcase with classes [99,100] had its contour color reversed.
That could probably be relatively easily addressed and definitely sounds useful to avoid confusion in terms of interpreting the results.
For future reference to reproduce this issue
from mlxtend.plotting import plot_decision_regions
import matplotlib.pyplot as plt
from sklearn import datasets
from sklearn.svm import SVC
# Loading some example data
iris = datasets.load_iris()
X = iris.data[:100, [0, 2]]
y = iris.target[:100]
# Training a classifier
svm = SVC(C=0.5, kernel='linear')
svm.fit(X, y)
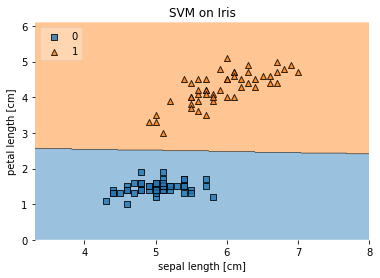
# Plotting decision regions
plot_decision_regions(X, y, clf=svm, legend=2)
# Adding axes annotations
plt.xlabel('sepal length [cm]')
plt.ylabel('petal length [cm]')
plt.title('SVM on Iris')
plt.show()
And then with class labels 3 and 4:
import numpy as np

y2 = np.where(y == 0, 3, 4)

svm = SVC(C=0.5, kernel='linear')
svm.fit(X, y2)
plot_decision_regions(X, y2, clf=svm, legend=2)
plt.show()
