EOmaps
 EOmaps copied to clipboard
A library to create interactive maps of geographical datasets
![]()
![]()
![]()


![]()
A library to create interactive maps of geographical datasets.
- 🌍 EOmaps provides a simple and intuitive interface to visualize and interact with geographical datasets.
- ⬥ Data can be provided as 1D or 2D
lists,numpy-arrays,pandas.DataFrames - or directly from GeoTIFFs, NetCDFs and csv-files.
- ... usable also for large datasets with millions of datapoints!
- ⬥ WebMap layers, annotations, markers can be added with a single line of code
- ⬥ EOmaps is built on top of
matplotlibandcartopyand integrates wellpandasandgeopandas - 🌎 Quickly turn your maps into powerful interactive data-analysis widgets
- ⬥ use callback functions to interact with the data (or an underlying database)
- ⬥ compare multiple data-layers, WebMaps etc.
❗ update notice: ⚙ Port script from EOmaps v3.x to v4.x
🔨 Installation
To install EOmaps (and all its dependencies) via the conda package-manager, simply use:
conda install -c conda-forge eomaps
... to get a huge speedup, use mamba to solve the dependencies!
conda install -c conda-forge mamba
mamba install -c conda-forge eomaps
For more information, have a look at the installation instructions or checkout the quickstart guide 🚀 from 0 to EOmaps!
📖 Documentation
Make sure to have a look at the 🌳 documentation 🌳 which provides a lot of examples on how to create awesome interactive maps (incl. source code)!
✔️ Citation
Did EOmaps help in your research?
Consider supporting the development and add a citation to your publication!
![]()
🚀 Contribute
Found a bug or got an idea for an interesting feature?
Open an issue or start a discussion, and I'll see what I can do!
Interested in actively contributing to the library?
- Any contributions are welcome! (new features, enhancements, fixes, documentation updates, outreach etc.)
- Have a look at this 🌟 overview project to get an overview of existing ideas that could use some help.
- Get in touch by opening a discussion in the 🐜 Contribution section!

|
|

|

|

|
|
|

|
🌳 Basic usage
🛸 Checkout the documentation! 🛸
- A list of coordinates and values is all you need as input!
- plots of large (>1M datapoints) irregularly sampled datasets are generated in a few seconds!
- Represent your data
- as shapes with actual geographic dimensions (ellipses, rectangles, geodetic circles)
- via Voroni diagrams and Delaunay triangulations to get interpolated contour-plots
- via dynamic data-shading to speed up plots of extremely large datasets
- Re-project the data to any crs supported by cartopy
- Quickly add features and additional layers to the plot
- Markers, Annotations, WebMap Layers, NaturalEarth features, Scalebars, Compasses (or North-arrows) etc.
- Interact with the data via callback-functions.
from eomaps import Maps
# initialize Maps object
m = Maps(crs=Maps.CRS.Orthographic())
# add basic map-features from NaturalEarth
m.add_feature.preset.coastline()
m.add_feature.cultural_50m.admin_0_countries(fc="none", ec="g")
# easily visualize both structured and unstructured datasets
m.set_data(data=[1, 2, 3, 4], x=[45, 46, 47, 42], y=[23, 24, 25, 26], crs=4326)
# set the shape you want to use to represent the data-points
m.set_shape.geod_circles(radius=10000) # (e.g. geodetic circles with 10km radius)
# (optionally) classify the data
m.set_classify_specs(scheme=Maps.CLASSIFIERS.Quantiles, k=5)
# plot the data
m.plot_map(cmap="viridis", vmin=2, vmax=4)
# add a colorbar with a colored histogram on top
m.add_colorbar(histbins=200)
# add a scalebar
m.add_scalebar()
# add a compass (or north-arrow)
m.add_compass()
# add imagery from a variety of open-access WebMap services
m.add_wms.OpenStreetMap.add_layer.default()
# use callback functions to interact with the map!
m.cb.pick.attach.annotate()
# use multiple layers to compare and analyze different datasets!
m3 = m.new_layer(layer="layer 2")
m3.add_feature.preset.ocean()
# attach a callback to peek on layer 1 if you click on the map
m.cb.click.attach.peek_layer(layer="layer 2", how=0.4)
# attach callbacks to switch between the layers with the keyboard
m.cb.keypress.attach.switch_layer(layer=0, key="0")
m.cb.keypress.attach.switch_layer(layer="layer 2", key="1")
# get a clickable widget to switch between the available plot-layers
m.util.layer_selector()
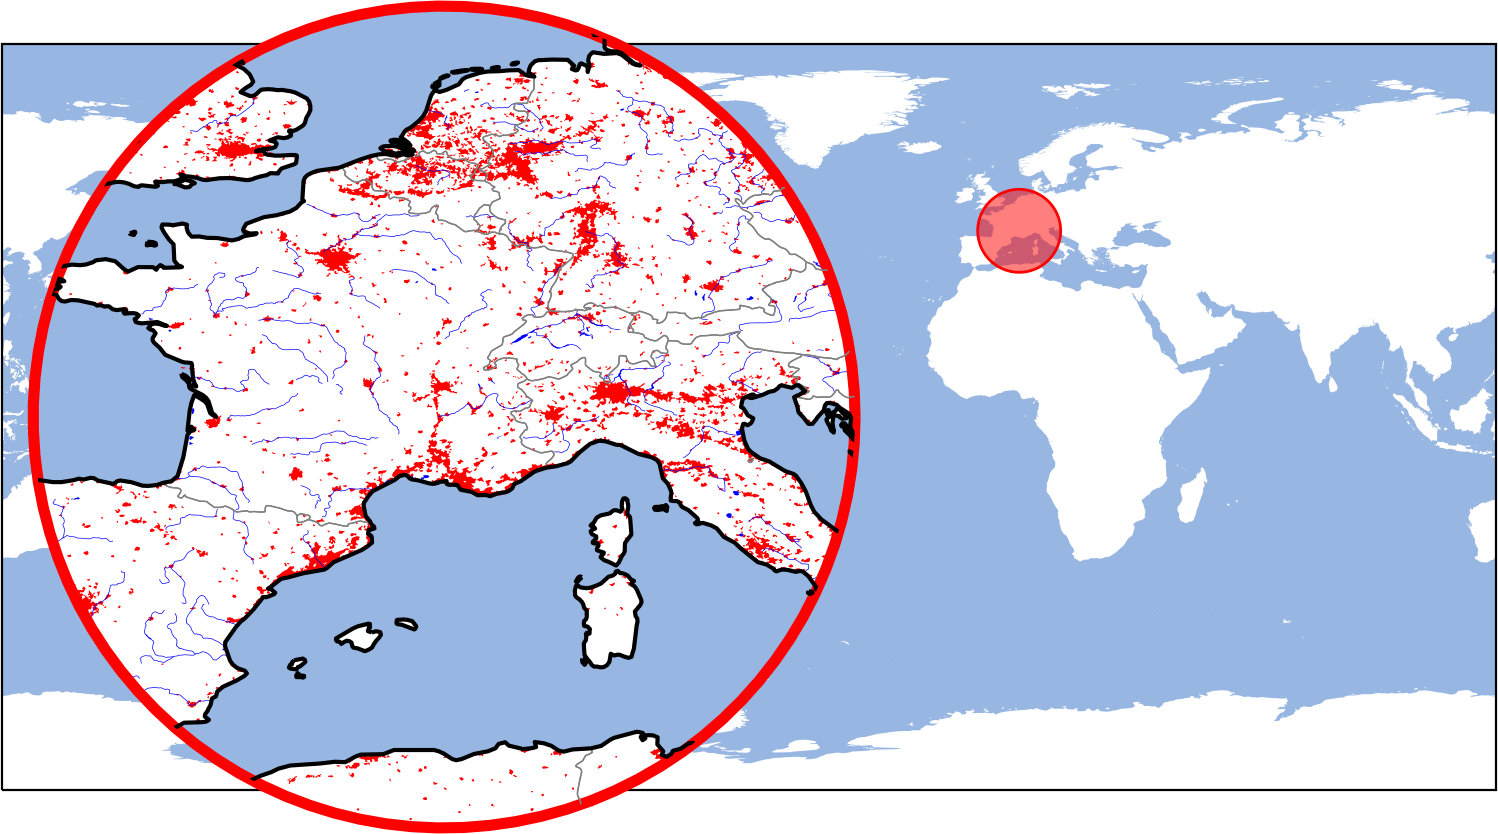
# add zoomed-in "inset-maps" to highlight areas on th map
m_inset = m.new_inset_map((10, 45))
m_inset.add_feature.preset.coastline(fc="g")
# ---- plot data directly from GeoTIFF / NetCDF or CSV files
m4 = m.new_layer_from_file.GeoTIFF(...)
m4 = m.new_layer_from_file.NetCDF(...)
m4 = m.new_layer_from_file.CSV(...)
🌼 Thanks to
- Jakob Quast for designing the nice logo!
Metadata
Owner
Metadata
A library to create interactive maps of geographical datasets