augury
 augury copied to clipboard
slow and often leads to browser crashes
-- please install the Augury Canary Build Chrome extension, as this will be used to test any new features or bug fixes.
Augury version (required): 6.0.5 Angular version (required): 1.19.1 Date: 2018-06-22 OS: macOS Hign Sierra 10.13.4 UI Framework: ng-zorro-antd
-- Please make sure you're using the latest version of Augury before reporting an issue.
Demo test application: -- Git repository for demo app showing the issue (optional but very helpful for difficult issues). -- If a code snippet will completely show the issue, please include it.
Description of issue: -- Include (clipped) screenshot images if possible.
Steps to reproduce:
- any way
Additional details:
None
@xunjianxiang - Can you provide some additional details that might help reproduce this? For instance:
- Does this occur right away or after your using augury? if so how long and what are you doing when it crashes?
- How big is the application?
- Are you running a lot of other chrome tabs, etc.
- Do you have a sample app you could share?
I've been having similar issues with our angular 5 application in development mode.
Memory footprint of Augury in chrome task manager shows it starts off at about 40mb then jumps to 300-400mb when inspecting some components properties. At this point, if I interact with my application, the chrome tab process spikes to 200+ % CPU and becomes unresponsive, ultimately I have to kill the tab to be able to use the app again. This happens every time I use Augury to inspect a component that has a fair amount of state with observable properties and also with services. The CPU spike only seems to happen if I'm trying to interact with my application while its loading the state of the component
I also have some problems regardin Augury recently. It works really sluggish, after inspecting component I have to wait for 30+ seconds to actually get the component data, the dev tools freeze for this waiting time and sometimes the whole page crashes.
Hey everyone, I think maybe this was caused by some refactoring in the bootstrapping logic that happened recently, but I think I've only seen it once. Is it as intermittent for all of you?
I'm trying over and over to replicate it without any luck. I tried a very dense UI tree, but maybe it's more specific than that. Any hints? If someone shares a project where it can be reliably recreated, I'll get it fixed immediately.
Sorry for the slow turn around on this. Augury has not been my focus lately.
Maybe it is not related, but I am experiencing this issue when I enable Redux DevTools plugin in Chrome. I did not test this in Firefox. But when I disable Redux DevTools, Augury starts working as intended. Otherwise, there is a memory spike and the browser tab crashes. Hopefully, this helps for replicating the issue
Maybe it is not related, but I am experiencing this issue when I enable Redux DevTools plugin in Chrome. I did not test this in Firefox. But when I disable Redux DevTools, Augury starts working as intended. Otherwise, there is a memory spike and the browser tab crashes. Hopefully, this helps for replicating the issue
@petarblazevski thank you.
I disabled Redux DevTools extension, restarted chrome, and Augury worked fine again. Looks like they are not playing well with each other 😉
Also happening here. It can be replicated in Chrome (Mac) with a brand new angular project (generated with the 'ng new' command), and including the following in app.module.ts:
NgxsModule.forRoot([])
If you need any more specific information I'd be happy to help!
I recently visited a website with the Augury Chrome extension enabled and Chrome quickly became extremely slow and unresponsive to the point where it needed to be force quit. This behavior continued even after I restarted my computer.
However when I disabled the Augury extension, the website loaded and operated just fine.
With Augury enabled, the console eventually spit out this error message 696 times in rapid succession:
Uncaught (in promise) DOMException: Failed to execute 'postMessage' on 'Window': An object could not be cloned.
    at Object.t.messageJumpContext (chrome-extension://elgalmkoelokbchhkhacckoklkejnhcd/build/content-script.js:24:9921)
    at chrome-extension://elgalmkoelokbchhkhacckoklkejnhcd/build/content-script.js:24:8583
I know this particular website is built on a fairly complex Angular application using some advanced techniques such as server-side rendering, but I'm not sure exactly what aspect of the application is causing Augury to blow up like this.
Hi everyone,
We just released a new version of Augury (1.24.0) where we added some sanity controls to prevent some observables from firing constantly and causing the browser to slowdown and crash. If you could give that version a try and report back that would be great.
Thanks!
@feeloor I just tried the plugin. As soon as I open the DevTools and select the Augury tab, I am getting the following error:
Unhandled Promise rejection: Cannot read property 'ngInjectableDef' of null ; Zone: <root> ; Task: Promise.then ; Value: TypeError: Cannot read property 'ngInjectableDef' of null
I am using Angular 6.1.3
With Angular 8, I am getting this error TypeError: Reflect.getMetadata is not a function
@sumitarora yes it is enabled. I just tested the plugin on local dev, with AOT disabled and it works. I no longer see the memory leak issue
Thanks @petarblazevski I am looking into it now. Will push the fix soon.
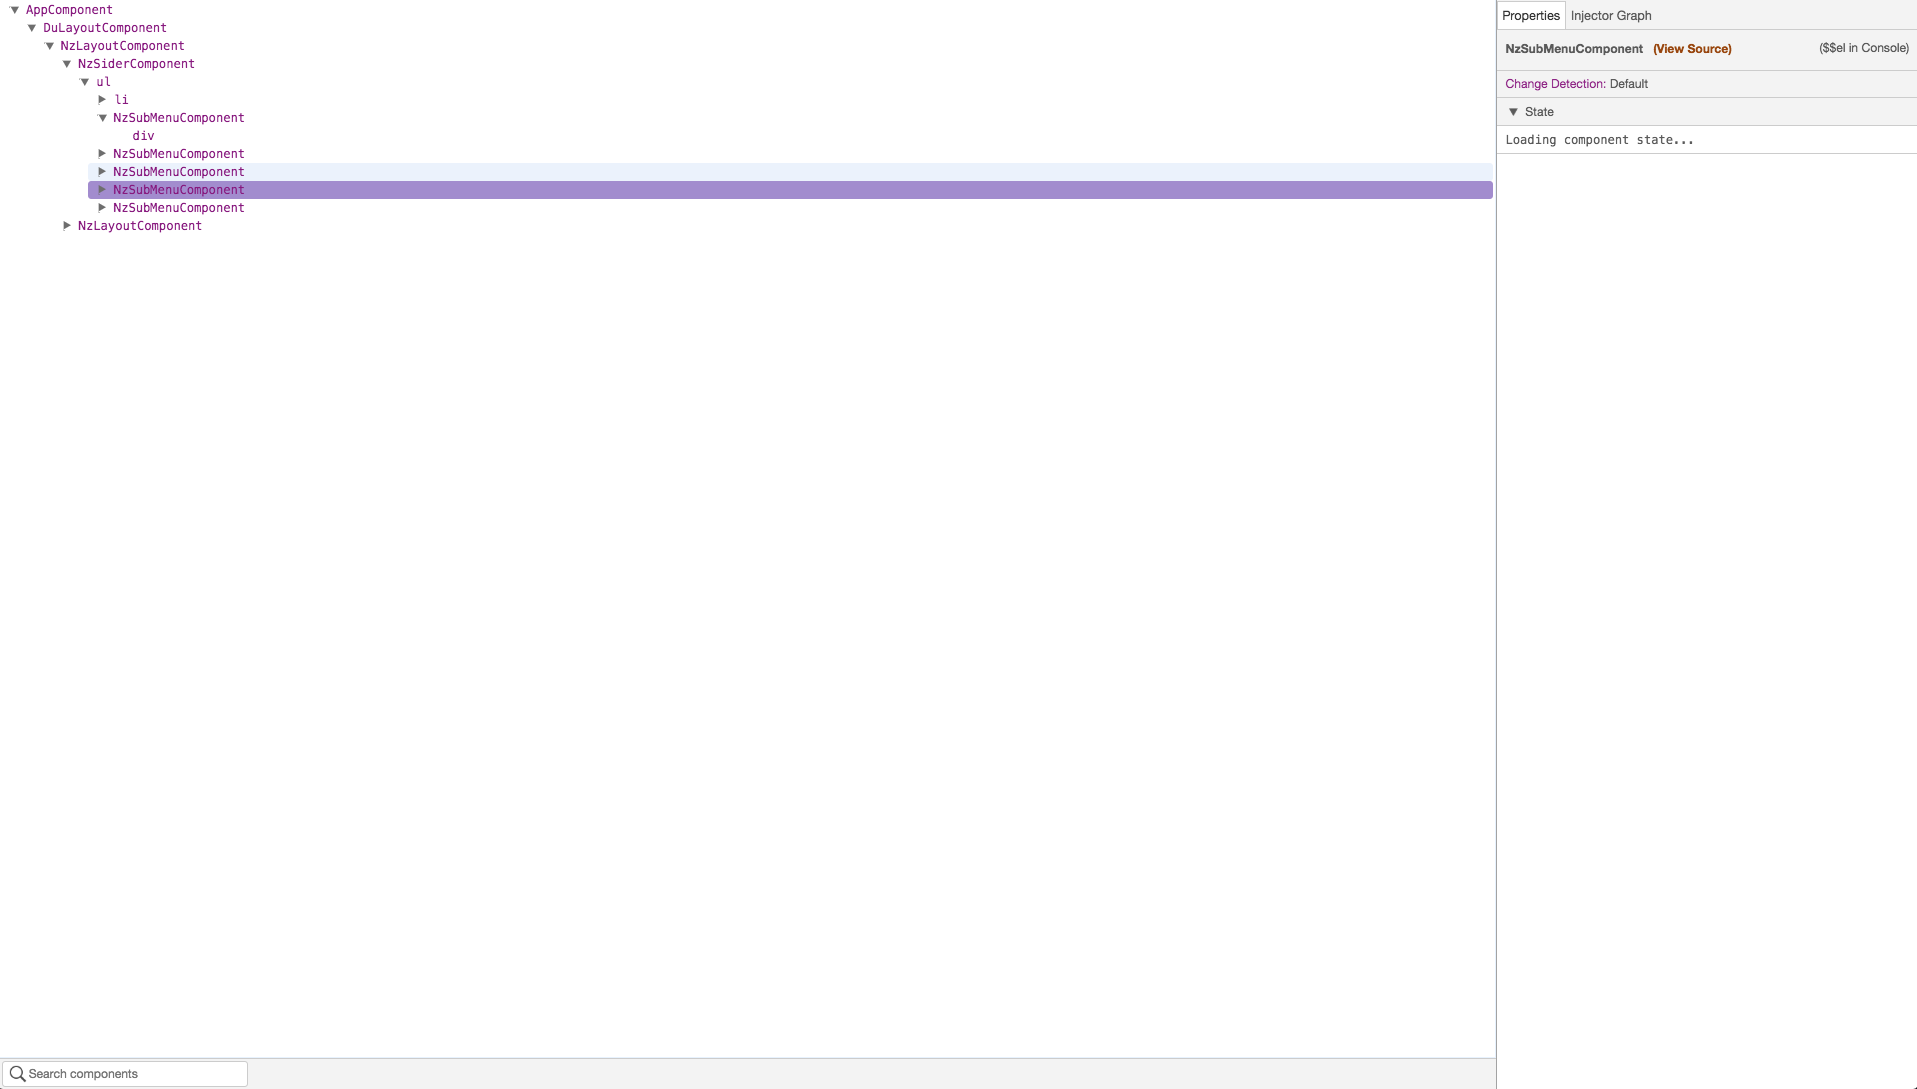
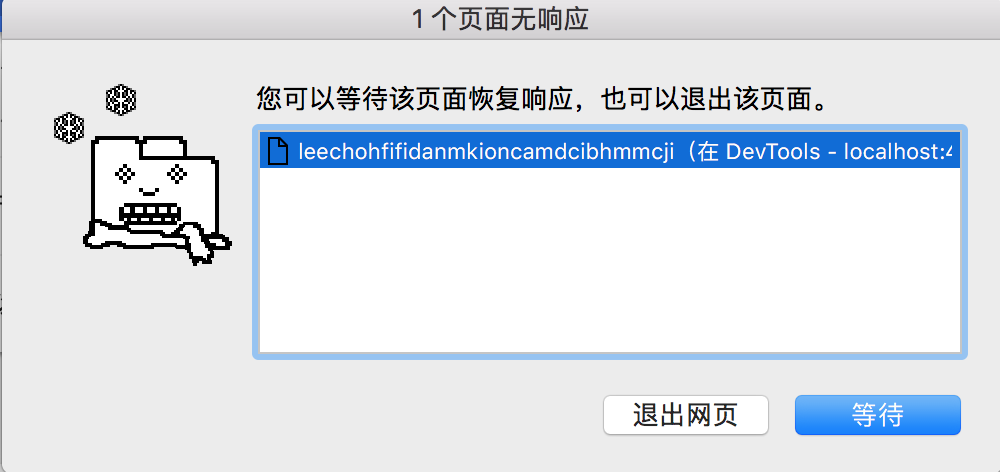
A bit of an improvement, but still seeing 'maximum call stack size exceeded'. I can now open Augury, view the component tree, click on a component, and then the error occurs. The Chrome tab then needs to be reopened.