Inversion of the predicted TTE
Hi Egil,
Thanks so much for creating the examples repo, this is super helpful!
One thing caught my attention in your data_pipeline_template notebook: the plot of predicted vs. actual TTE looks like the prediction is inverted (this is after your "Individual sequences" cell):
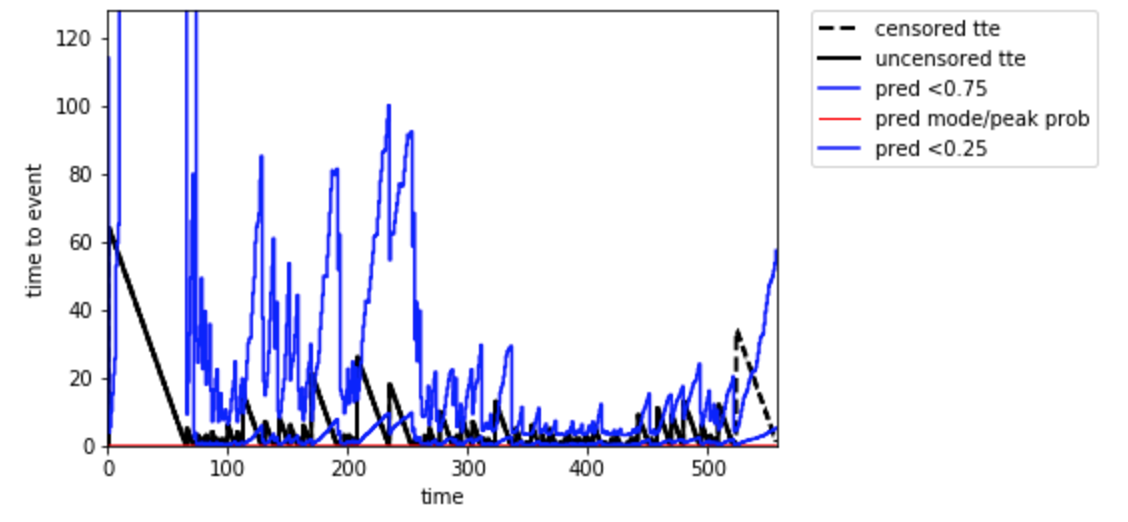
This doesn't happen for synthetic data, but it does seem to be a feature for irregularly sampled data. Do you know if it's because the initial alpha is not optimal, or for some other reason?
Thanks very much! Natalia
Hi! Sorry I thought I answered this issue but must have forgot to hit send!
I think its because in the real world, the further from an event (here a git-commit), the network learned it imples an increased risk for a longer time until the next event (~Churn)!