tmap

tmap copied to clipboard
`tm_add_legend()` does not show with `tm_sf()`
Hi,
tm_add_legend() is great for custom legends, but the legend seems to be lost when working with tm_sf().
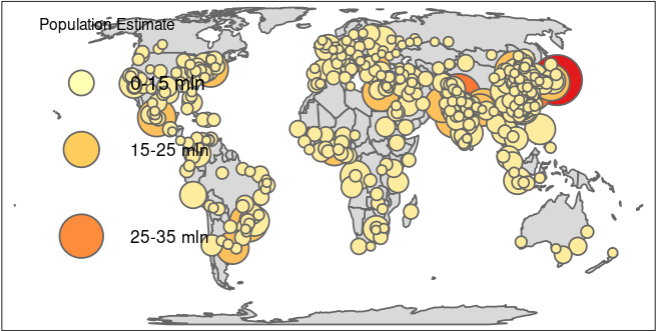
The example from help that works
## Not run:
library(sf)
data(World)
data(metro)

# legend bubble size (10, 20, 30, 40 million) are
# - are normlized by upper limit (40e6),
# - square rooted (see argument perceptual of tm_symbols), and
# - scaled by 2:
bubble_sizes <- ((c(10, 20, 30, 40) * 1e6) / 40e6) ^ 0.5 * 2

tm_shape(World) +
  tm_polygons() +
  tm_shape(metro) +
  tm_symbols(col='pop2020',
             breaks = c(0, 15, 25, 35, 40) * 1e6,
             n=4,
             palette = 'YlOrRd',
             size='pop2020',
             sizes.legend = c(10, 20, 30, 40) * 1e6,
             size.lim = c(0, 40e6),
             scale = 2,
             legend.size.show = FALSE,    # comment this line to see the original size legend
             legend.col.show = FALSE,     # comment this line to see the original color legend
             legend.size.is.portrait = TRUE) +
  tm_add_legend('symbol',
                col = RColorBrewer::brewer.pal(4, "YlOrRd"),
                border.col = "grey40",
                size = bubble_sizes,
                labels = c('0-15 mln','15-25 mln','25-35 mln','35-40 mln'),
                title="Population Estimate")
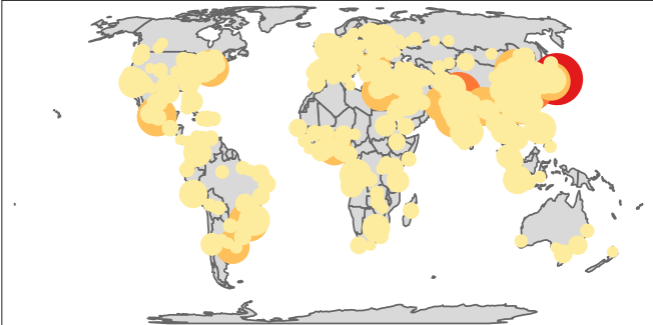
The example modified with tm_sf()
## Not run:
library(sf)
data(World)
data(metro)

# legend bubble size (10, 20, 30, 40 million) are
# - are normlized by upper limit (40e6),
# - square rooted (see argument perceptual of tm_symbols), and
# - scaled by 2:
bubble_sizes <- ((c(10, 20, 30, 40) * 1e6) / 40e6) ^ 0.5 * 2

tm_shape(World) +
  tm_polygons() +
  tm_shape(metro) +
  tm_sf(col='pop2020',
             breaks = c(0, 15, 25, 35, 40) * 1e6,
             n=4,
             palette = 'YlOrRd',
             size='pop2020',
             sizes.legend = c(10, 20, 30, 40) * 1e6,
             size.lim = c(0, 40e6),
             scale = 2,
             legend.size.show = FALSE,    # comment this line to see the original size legend
             legend.col.show = FALSE,     # comment this line to see the original color legend
             legend.size.is.portrait = TRUE) +
  tm_add_legend('symbol',
                col = RColorBrewer::brewer.pal(4, "YlOrRd"),
                border.col = "grey40",
                size = bubble_sizes,
                labels = c('0-15 mln','15-25 mln','25-35 mln','35-40 mln'),
                title="Population Estimate")
Not solved yet, but an easy workaround is to place the legend before the tm_sf layer group, so:
tm_shape(World) +
	tm_polygons() +
	tm_add_legend('symbol',
				  col = RColorBrewer::brewer.pal(4, "YlOrRd"),
				  border.col = "grey40",
				  size = bubble_sizes,
				  labels = c('0-15 mln','15-25 mln','25-35 mln','35-40 mln'),
				  title="Population Estimate") +
	tm_shape(metro) +
	tm_sf(col='pop2020',
		  breaks = c(0, 15, 25, 35, 40) * 1e6,
		  n=4,
		  palette = 'YlOrRd',
		  size='pop2020',
		  sizes.legend = c(10, 20, 30, 40) * 1e6,
		  size.lim = c(0, 40e6),
		  scale = 2,
		  legend.size.show = FALSE,    # comment this line to see the original size legend
		  legend.col.show = FALSE,     # comment this line to see the original color legend
		  legend.size.is.portrait = TRUE)