sf
 sf copied to clipboard
Problem for extract mean values between same coordinates in different csr
I have a data set extracted from S2 satellite rasters (10 x 10 meters) with 12 values (ras.df.ll), but 6 is in a tile (T21JYG) and the same 6 coordinates but in a second tile (T21JYG). I'd like to calculate the mean in the same (x,y coordinates) between tiles without success. In my example:
library(sfheaders)
library(dplyr)
library(sf)

# Raster (10x10 meters) info in data frame 1 - crs +proj=utm +zone=21 +south +datum=WGS84 +units=m +no_defs
x <-c(789385,789395,789405,789415,789425,789435)
y <-c(6626865,6626865,6626865,6626865,6626865,6626865)
tile <- rep("T21JYG",6)
values <-c(321,249,234,238,224,244)
ras.ds1<-data.frame(x,y,tile,values)
ras.ds1.sf <- st_as_sf(ras.ds1, coords = c("x", "y"), crs = 32721, agr = "constant")
ras.ds1.sf.ll <- st_transform(ras.ds1.sf, crs=4326)
ras.ds1.sf.ll


# Raster (10x10 meters) info in data frame - crs +proj=utm +zone=22 +south +datum=WGS84 +units=m +no_defs
x <-c(213285,213295,213305,213315,213325,213335)
y <-c(6626955,6626955,6626955,6626955,6626955,6626955)
tile <- rep("T22JBM",6)
values <-c(336,355,363,426,341,308)
ras.ds2 <-data.frame(x,y,tile,values)
ras.ds2.sf <- st_as_sf(ras.ds2, coords = c("x", "y"), crs = 32722, agr = "constant")
ras.ds2.sf.ll <- st_transform(ras.ds2.sf, crs=4326)
ras.ds2.sf.ll


# Join information
ras.ds.sf.ll <- rbind(ras.ds1.sf.ll, ras.ds2.sf.ll)
ras.df.ll <- sf_to_df(ras.ds.sf.ll, fill = TRUE, unlist = NULL)

# Mean values by same coordinate
ras.df.ll %>%
  group_by(x,y) %>% dplyr::summarise(values=mean(values))

# # A tibble: 12 x 3
# # Groups:   x [12]
#        x     y values
#    <dbl> <dbl>  <dbl>
#  1 -54.0 -30.5    321
#  2 -54.0 -30.5    249
#  3 -54.0 -30.5    234
#  4 -54.0 -30.5    238
#  5 -54.0 -30.5    224
#  6 -54.0 -30.5    244
#  7 -54.0 -30.5    336
#  8 -54.0 -30.5    355
#  9 -54.0 -30.5    363
# 10 -54.0 -30.5    426
# 11 -54.0 -30.5    341
# 12 -54.0 -30.5    308
This output is not correct, because the group_by(x,y) does not recognise 1st row in the first tile is the same coordinate of 1st row in the second tile but originally in another CRS in UTM. Means for me a transformation problem between projections.
The correct output for the variable values is:
#  x         y      values
# -53.986	-30.456	328.5
# -53.986	-30.456	302
# -53.986	-30.456	298.5
# -53.986	-30.456	332
# -53.986	-30.456	282.5
# -53.986	-30.456	276
Please, any help using some sf solution for it?
Thanks in advance,
Alexandre
Hi Alexandre,
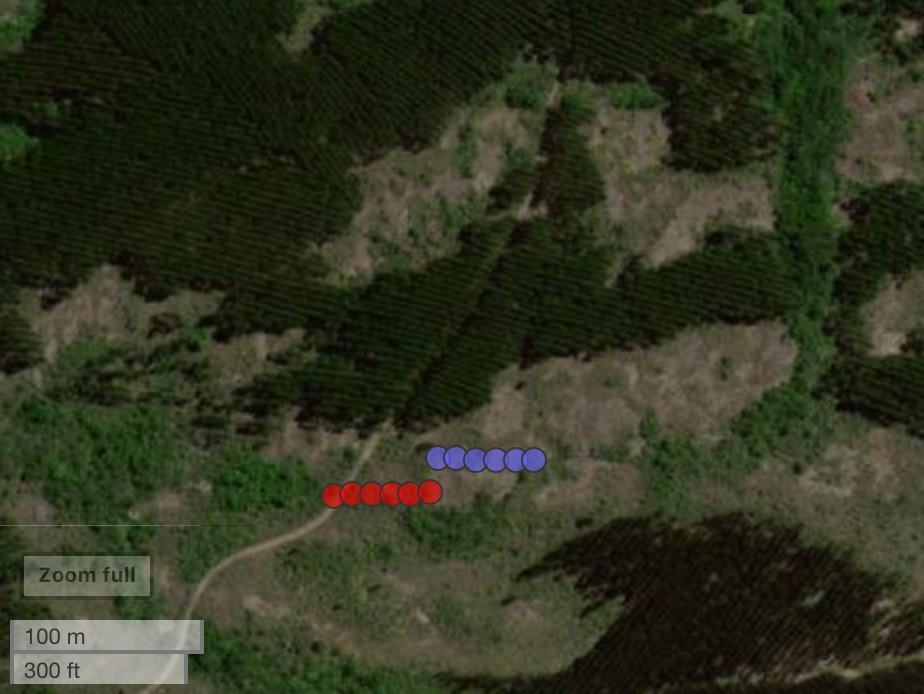
you seem to assume, that the two point sets you define (ras.ds1 and ras.ds1) are referencing the same locations.
What makes you so sure about that?
