mapview

mapview copied to clipboard
col.regions doesn't work well when subsetting
Hello,
It seems there is a problem with col.regions when a factor has got multiple levels and dataset only has one used level. Bellow is a reproducing example.
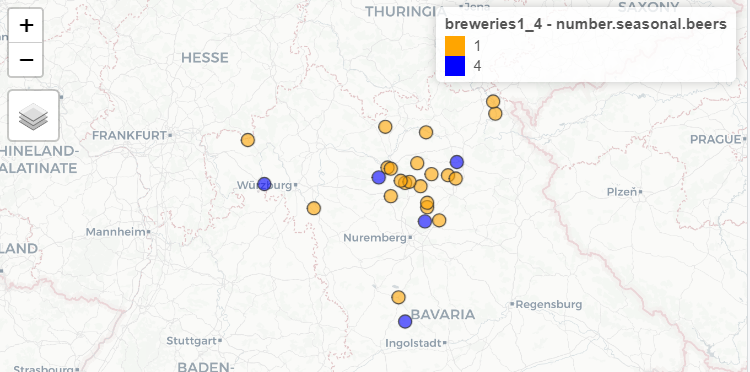
First map view give the right output with points appearing orange and blue.
Second map give the wrong output with points red (first color of legend) instead of blue

library(mapview)

# selecting only not NA seasonnal beers and transforming as factor
breweries<-breweries[!is.na(breweries$number.seasonal.beers),]

breweries$number.seasonal.beers <-
  as.factor(breweries$number.seasonal.beers)
summary(breweries$number.seasonal.beers)

# personnal color scale with 2 non missing levels --> work with orange and blue points

breweries1_4<-breweries[breweries$number.seasonal.beers%in%c("1","4"),]

mapview(
  breweries1_4,
  zcol = "number.seasonal.beers",
  col.regions = c("red", "orange", "yellow", "green", "blue", "white")
)

# same map seleting only one levels. Should be blue points and not red
breweries4<-breweries[breweries$number.seasonal.beers=="4",]

mapview(
  breweries4,
  zcol = "number.seasonal.beers",
  col.regions = c("red", "orange", "yellow", "green", "blue", "white")
)