mapview

mapview copied to clipboard
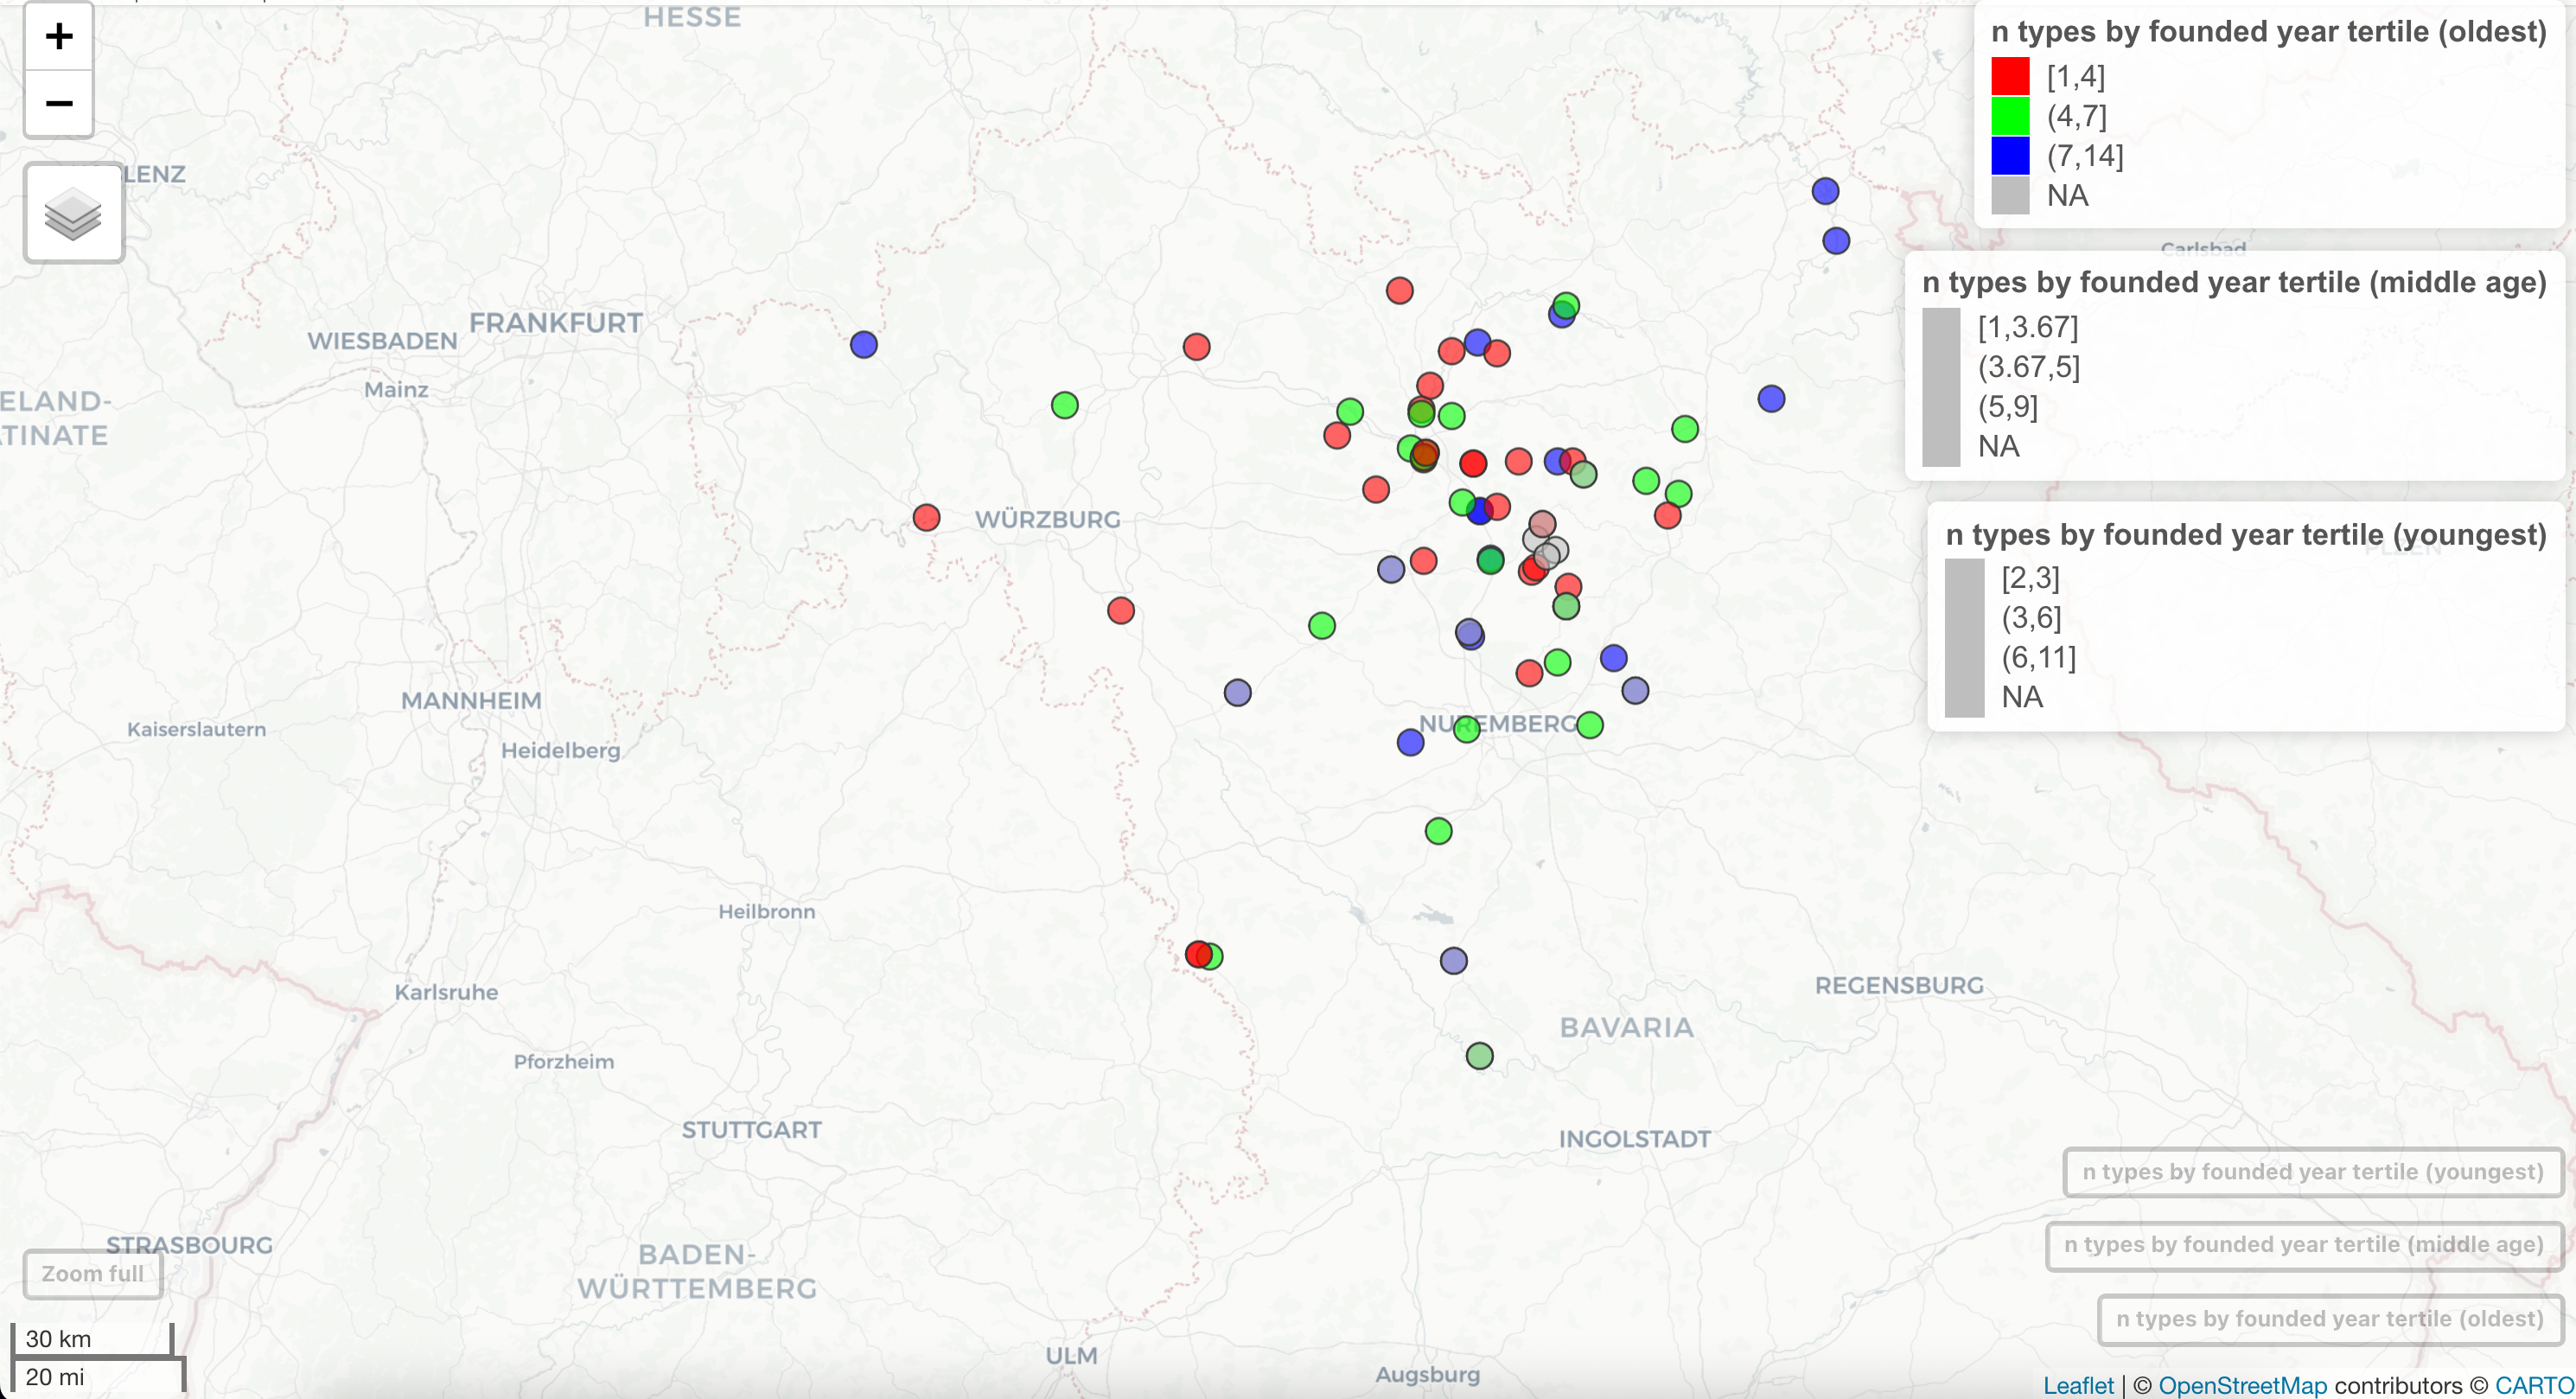
Unexpected gray legend labels when factor was created within categories of another factor.
library(mapview)
library(tidyverse)
library(sf)
Possibly related to https://github.com/r-spatial/mapview/issues/323 and https://github.com/r-spatial/mapview/issues/336
Hi Tim and all, I'd like to visualize a three-level factor within levels of another three-level factor. Within the first level of the first factor variable, the legend appears as expected. Within the other two levels, however, the vector data renders with the expected colors, but the legend labels are all gray.
I don't get the issue when I convert the second-level factor (n_types_by_founded_year_tertile, below) to character, but then the legend labels don't print in the correct order.
Thanks as always for the great package-
breweries_wrangle = mapview::breweries %>%
  mutate(
    founded_year_tertile = cut_number(founded, 3)
    ) %>%
  group_by(founded_year_tertile) %>%
  mutate(
    n_types_by_founded_year_tertile = cut_number(number.of.types, 3)
  ) %>%
  ungroup()

table(breweries_wrangle$founded_year_tertile)
mv_tertile_1 = breweries_wrangle %>%
  filter(founded_year_tertile== "[1.35e+03,1.77e+03]") %>%
  mapview(
    col.regions = rainbow(3),
    zcol = "n_types_by_founded_year_tertile",
    layer.name = "n types by founded year tertile (oldest)")

mv_tertile_2 = breweries_wrangle %>%
  filter(founded_year_tertile== "(1.77e+03,1.88e+03]") %>%
  mapview(
    col.regions = rainbow(3),
    zcol = "n_types_by_founded_year_tertile",
    layer.name = "n types by founded year tertile (middle age)")

mv_tertile_3 = breweries_wrangle %>%
  filter(founded_year_tertile== "(1.88e+03,2.01e+03]") %>%
  mapview(
    col.regions = rainbow(3),
    zcol = "n_types_by_founded_year_tertile",
    layer.name = "n types by founded year tertile (youngest)")

mv_tertile_1+
mv_tertile_2+
mv_tertile_3