Strange behavior with more than one popup open on two maps
Hi, thanks for the package and apologies if this isn't a mapview issue directly, but I haven't found this issue reported elsewhere. I am using R Markdown to create an html file that includes two separate leaflet maps, calling two separate sets of popupGraphs made with ggplot2. When I open a popup in the first map, leave it open and then open a popup in the second map, the second popup shows a partial/distorted legend of the first graph instead of its own legend. It doesn't happen if I close the first popup before clicking on the second, or if I go in reverse order, opening a popup in the second map first. I was able to reproduce it with a toy example (see screen shot attached). Any ideas?

Yes, here it is:
Map1
dat = data.frame(
  species = c('Proteo', 'Bactero', 'Actino', 'Firmi', 'Other'),
  value = c(0.6, 0.2, 0.15, 0.03, 0.02),
  x = -93,
  y = 41.9)

library(ggplot2)
p = ggplot(dat, aes(x=1, y=value, fill=species)) + geom_col()
pop.plots = mapview::popupGraph(p, type='svg', width=200, height=200)

dat = sp::SpatialPointsDataFrame(
  coords=dat[1, c('x', 'y')], proj4string=sp::CRS('+proj=longlat'), data=dat[1, ])

library(leaflet)
leaflet() %>%
  addProviderTiles("Stamen.Terrain", group='Terrain') %>%
  addCircleMarkers(data=dat, popup=~pop.plots)
Map2
dat2 = data.frame(
  guild = c('abc', 'bcd', 'cde', 'def', 'efg'),
  value = c(0.5, 0.2, 0.15, 0.03, 0.12),
  x = -92,
  y = 41.9)

p2 = ggplot(dat2, aes(x=1, y=value, fill=guild)) + geom_col()
pop.plots2 = mapview::popupGraph(p2, type='svg', width=200, height=200)

dat2 = sp::SpatialPointsDataFrame(
  coords=dat2[1, c('x','y')], proj4string=sp::CRS('+proj=longlat'), data=dat2[1,])

leaflet() %>%
  addProviderTiles("Stamen.Terrain", group='Terrain') %>%
  addCircleMarkers(data=dat2, popup=~pop.plots2)
This is a result of duplicate ids that result from native svg creation in R. id in the DOM need to be unique. The only solution for this that I know of is svglite if you want to stick with svg. @tim-salabim, are you willing to accept another dependency? If so, I can submit a pull over the next couple of days.
@kdybala thanks for the reprex! @timelyportfolio yes, a svglite dependency is fine, especially as we still haven't found a proper way of including png popups in non-standard locations (tempdir() only). In case you have a clever idea addressing this issue too, I'd appreciate any input.
I forgot about this one. I'll try to quickly assemble a prototype this week.
@timelyportfolio I've merged your PR. When I run the svg example of popupGraph I see some strange behaviour that when we click on a point to open a graph, the fill color of all points disappears.
library(mapview)
library(sp)

data(meuse)
coordinates(meuse) = ~ x + y
proj4string(meuse) = CRS("+init=epsg:28992")

## create plots with points colored according to feature id
library(lattice)
p = xyplot(copper ~ cadmium, data = meuse@data, col = "grey")
p = mget(rep("p", length(meuse)))

clr = rep("grey", length(meuse))
p = lapply(1:length(p), function(i) {
  clr[i] = "red"
  update(p[[i]], col = clr)
})

mapview(meuse, popup = popupGraph(p, type = "svg"))
Any ideas?
@tim-salabim, bummer I see it now, and unfortunately I can't immediately think of a good workaround. svglite uses <defs><style> which are not isolated, so the styles of the popup svg will infect the entire dom. For this to work, we would need to add some specificity to the popup styles. I will try to think of some solutions since I still think svglite is a better long-term solution.
@timelyportfolio I still see the same behaviour as before... ?
FWIW, we have a custom CSS for popups in mapview. In popupTable we simply set attr(<popstring>, "popup") = "mapview" which I tried for the svg case also, but it didn't change the behavious described above.
Any more ideas?
That is odd. Can you send me a screenshot of the dom element for the popup? I just tried again, and this is working for me, but there is no telling all the hacks and dev versions that I have on my system.

with the popup DOM element

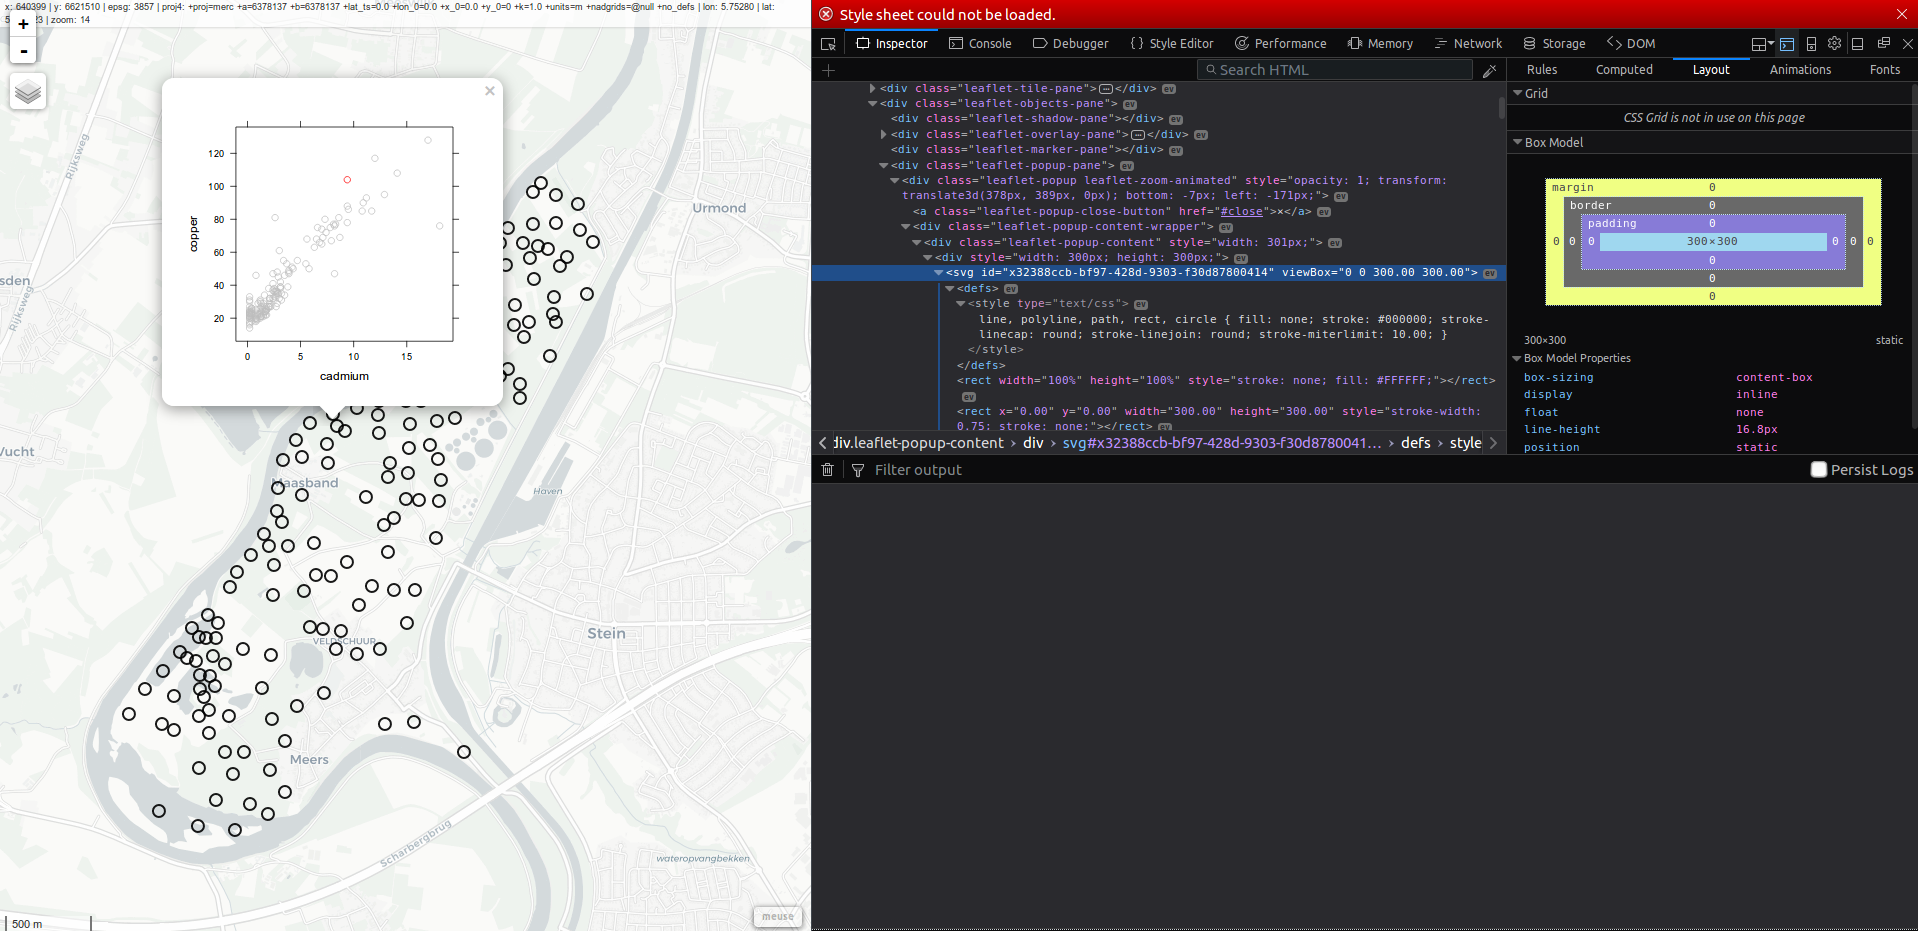
ok, I think I see what is happening. My un-robust gsub is not adding the element id to the style, so it is not applied. I will try to think through other solutions to this problem.