Save Hexagon into shape file
Using dggridR to save the Hexagon grids into shape file to be used in ArcMap, Cells which cross -180/180 degrees can present difficulties for plotting, As a result, such cells will have components in the range [180,360) can you please let me know how to disconnect these grids?
code
library(dggridR)
dggs_test <- dgconstruct(res=20)
res <- dg_closest_res_to_spacing(dggs_test,spacing=1000,round='down',metric=TRUE)
dggs_test <- dgsetres(dggs_test,res)
grid_issam <- dgearthgrid(dggs_50,savegrid="D:/New_R/shp/temp8.shp") #Save directly to a file
gridsas <- as(dggs_50, "SpatialPolygonsDataFrame")

Rather than saving the grid directly to a shapefile in your call to dgearthgrid, you can have it return a SpatialPolygon frame object. From there you can manipulate the polygons that are causing you trouble and then save it to a shape file with a call to writeOGR from the rgdal library
Also, I don't think your above code works as shared because dggs_50 isn't initialized. Perhaps it should be dggs_test instead?
thanks for that, how to do that? also can I fix 180, -180 hexagons problems.
global <- dgearthgrid(dggs_test, frame=FALSE)
will make global a SpatialPolygon object. To convert this to a SpatialPolygonsDataFrame, you have to create an ID for each object in global
global.cell <- data.frame(cell=getSpPPolygonsIDSlots(global), row.names=getSpPPolygonsIDSlots(global))
global <- SpatialPolygonsDataFrame(global, global.cell)
You can then modify all the latitudes to map to [0, 360] in a way you feel is most appropriate. Based on the map image you attached, I think your modification should be something like:
for(i in 1:length(global@polygons)) {
  global@polygons[[i]]@polygons[[1]]@coords[,1] <- global@polygons[[i]]@polygons[[1]]@coords[,1] +360 %% 360
}
Then you can use a call to writeOGR to save this as a shapefile to load into ArcMap.You can then look at this thread here on the ESRI forum to see how to properly plot polygons that pass through the meridian: https://community.esri.com/thread/67155
Thanks Joseph,
I made global a SpatialPolygon object
but for loop does not work, as Polygons is not define
for(i in 1:length(global@polygons) {
global@polygons[[i]]@polygons[[1]]@coords[,1] <- global@polygons[[i]]@polygons[[1]]@coords[,1] +360 %% 360
}
Error: no slot of name "polygons" for this object of class "Polygons"
Did you do the conversion to a 'SpatialPolygonDataFrame' object? The code block proceeding the for loop does that.
Apologies, syntax error in my code. second polygon should be capitalized
for(i in 1:length(global@polygons)) {
  global@polygons[[i]]@Polygons[[1]]@coords[,1] <- global@polygons[[i]]@Polygons[[1]]@coords[,1] +360 %% 360
}
you do not need to apologies, it is working ;) do I need to save global as an object?? writeOGR(global, ".", "D:/New_R/shp/", driver = "ESRI Shapefile")
Looks like I made an error in my transformation code. Please try the following instead:
for(i in 1:length(global@polygons)) {
  global@polygons[[i]]@Polygons[[1]]@coords[,1] <- (global@polygons[[i]]@Polygons[[1]]@coords[,1] +360) %% 360
}
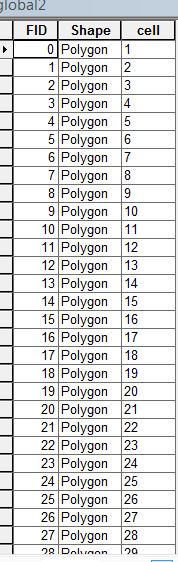 I think because cell number not fit with FID number
It looks like my point transformation caused your issue to be shifted from the +/- 180 meridian to the 0 meridian. The FID/cell mismatch is just a mismatch between ArcMap's automatically generated IDs and the cell IDs from DGGS. It shouldn't affect the actual polygon coordinates.
I think the below will fix it by only updating the shapes that span the meridian.
for(i in 1:length(global@polygons)) {
  if(max(global@polygons[[i]]@Polygons[[1]]@coords[,1]) -
     min(global@polygons[[i]]@Polygons[[1]]@coords[,1]) > 180) {
    global@polygons[[i]]@Polygons[[1]]@coords[,1] <- (global@polygons[[i]]@Polygons[[1]]@coords[,1] +360) %% 360
  }
}
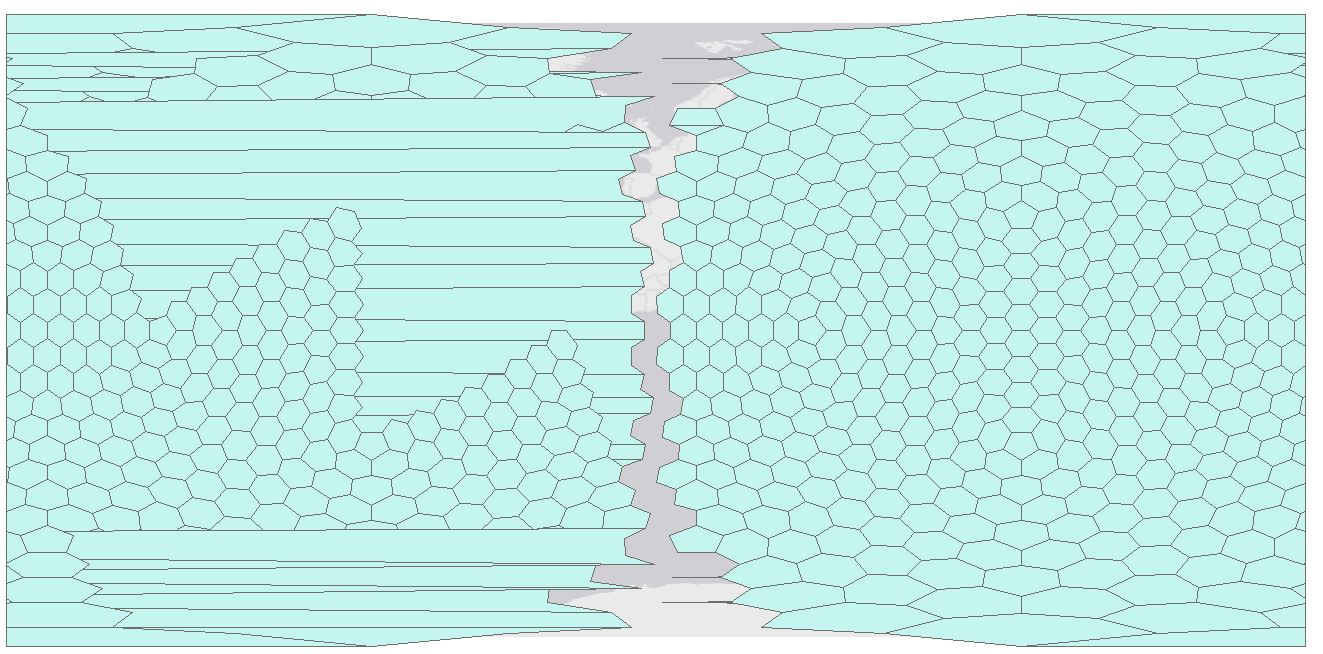
Hello Joseph, I've tried your your updated code, it is looking better thank you. however, in comparison with hexagons cells similar sizes there are few problem on some cells on the right hand side covering (Alasca, Antarctica) all hexagon cells outside the map frame.
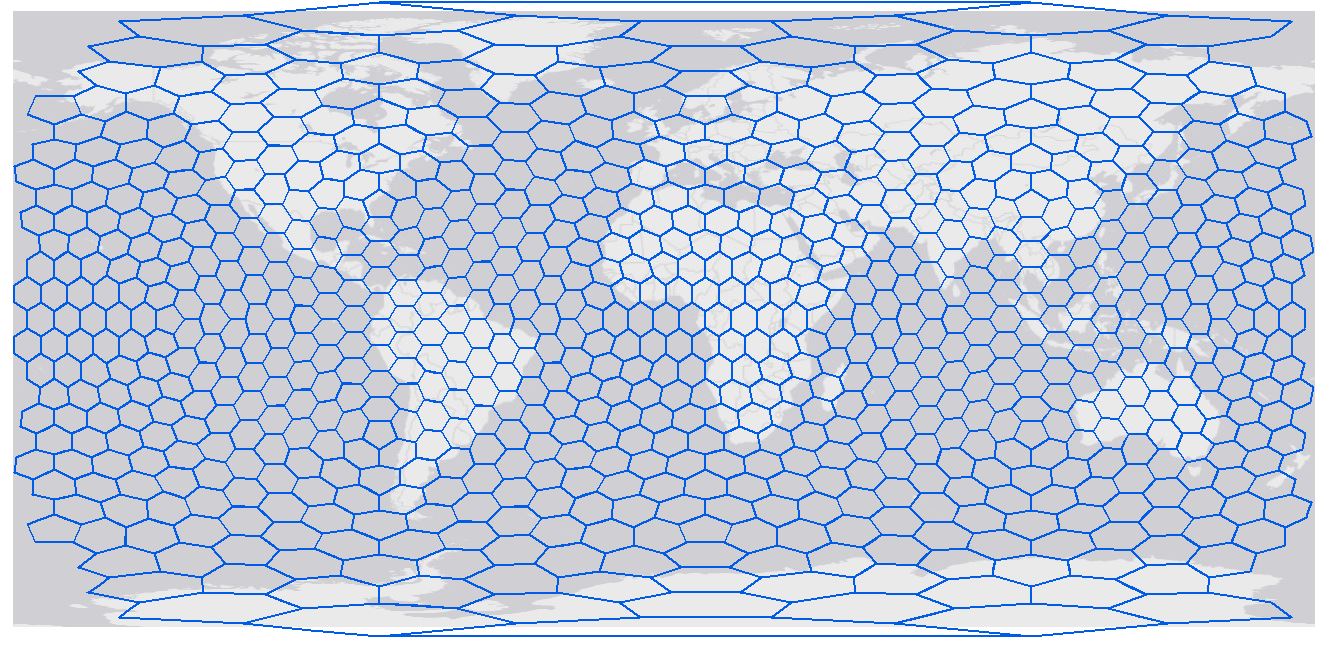 it should look like this hexagon cells, you can notice there is one cell missing cover Greenland on the top
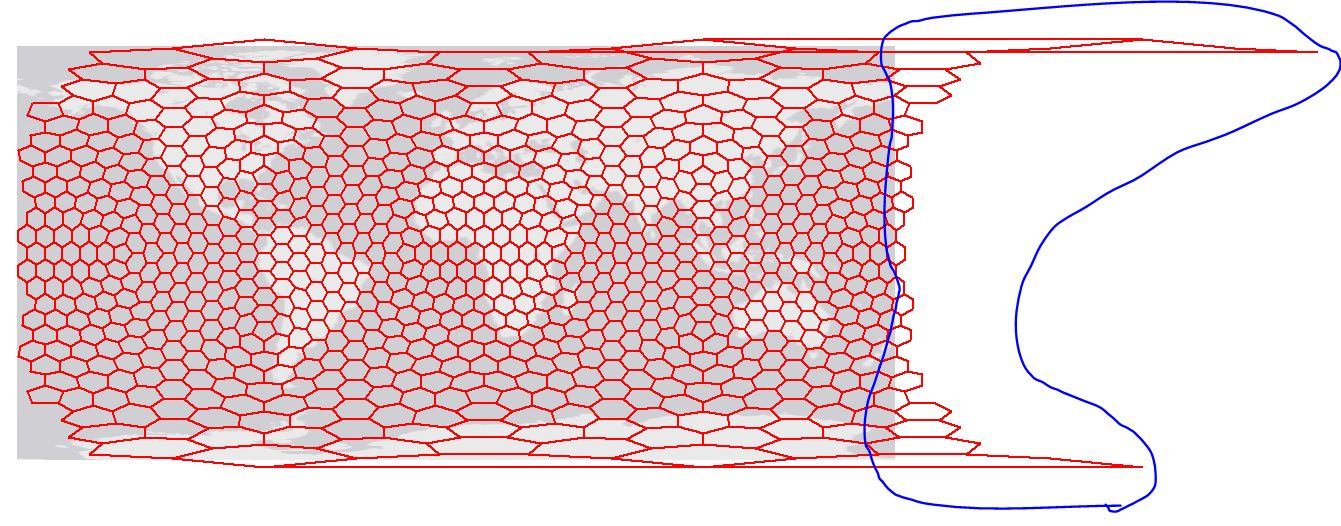
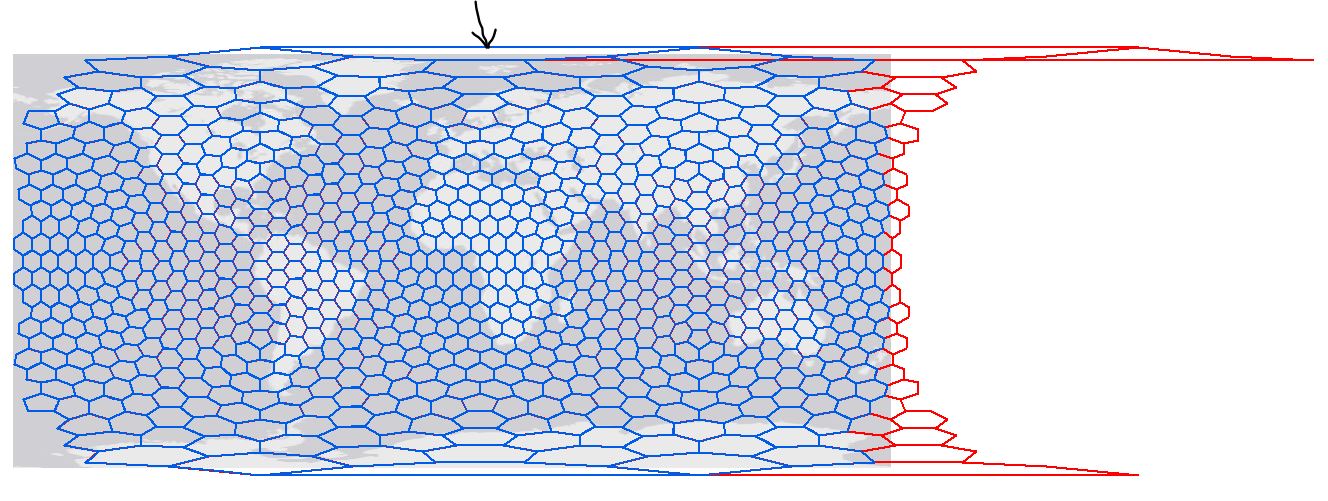 if we combined two layers (blue the correct and red has produced by your code, you can notice the cells on the right hand side and one missing on the top
The red cells on the right are the ones that are supposed to wrap around and include the missing areas on the left hand side of your map. I think there is some functionality in ArcMap to take those red cells and split them into 2 shapes clipped by the +180/-180 Meridian and move the corresponding piece to the other side of the map. The link I posted in my first response should give some hints on how to do that. I'm not sure how to do it myself.
As for the cell on the top, I am not sure why it is not displayed. Have you checked that the global variable contains that cell? The last code I posted might be incorrectly modifying it. You can try increasing the 180 threshold to something like 270?
Using 270 has solved top cell, thanks for help.
i am doing research on the following:- Have you managed to work with raster vector layers ? Have you used two or three cell sizes in the same time to display data, for example big size cells to represent rural density meanwhile small cells for urban density?
thanks again
I'm a bit confused on what you are trying to do. Density is dependent on the area of the grid you are using. So modifying the grid size for areas of lower density and areas of higher density will cause some distortion among your measures. To rectify this, you will have to normalize your statistics by the area of each cell. This sort of goes against the idea of using a uniform grid.
If you are simply trying to visualize some data, perhaps something like this would be easier to use: http://desktop.arcgis.com/en/arcmap/10.3/map/working-with-layers/using-proportional-symbols.htm
@alkenani, if you are satisfied that you have been able to get the answer to your original question, please mark this issue as closed.
But please open a pull request if there's a way to improve the documentation/code.
@r-barnes, I opened another issue to discuss some possible improvements. I cribbed the 180 filter idea I posted in this thread from the dg_process_polydata function and through this exercise found that 180 won't really cover all the edge cases. Working my way towards improving that and will post a pull request for it.
I think ideas from this thread can be used to improve how the SpatialPolygons are created to make generating shape files a bit more straightforward for this scenario.
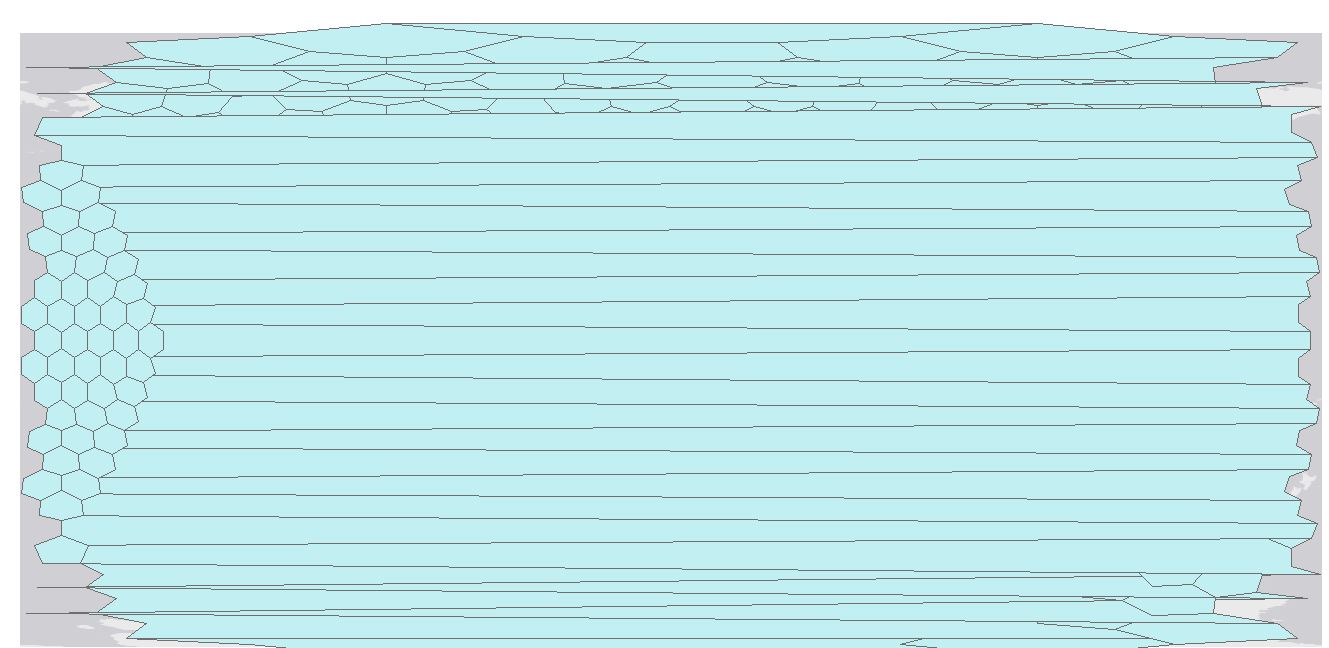
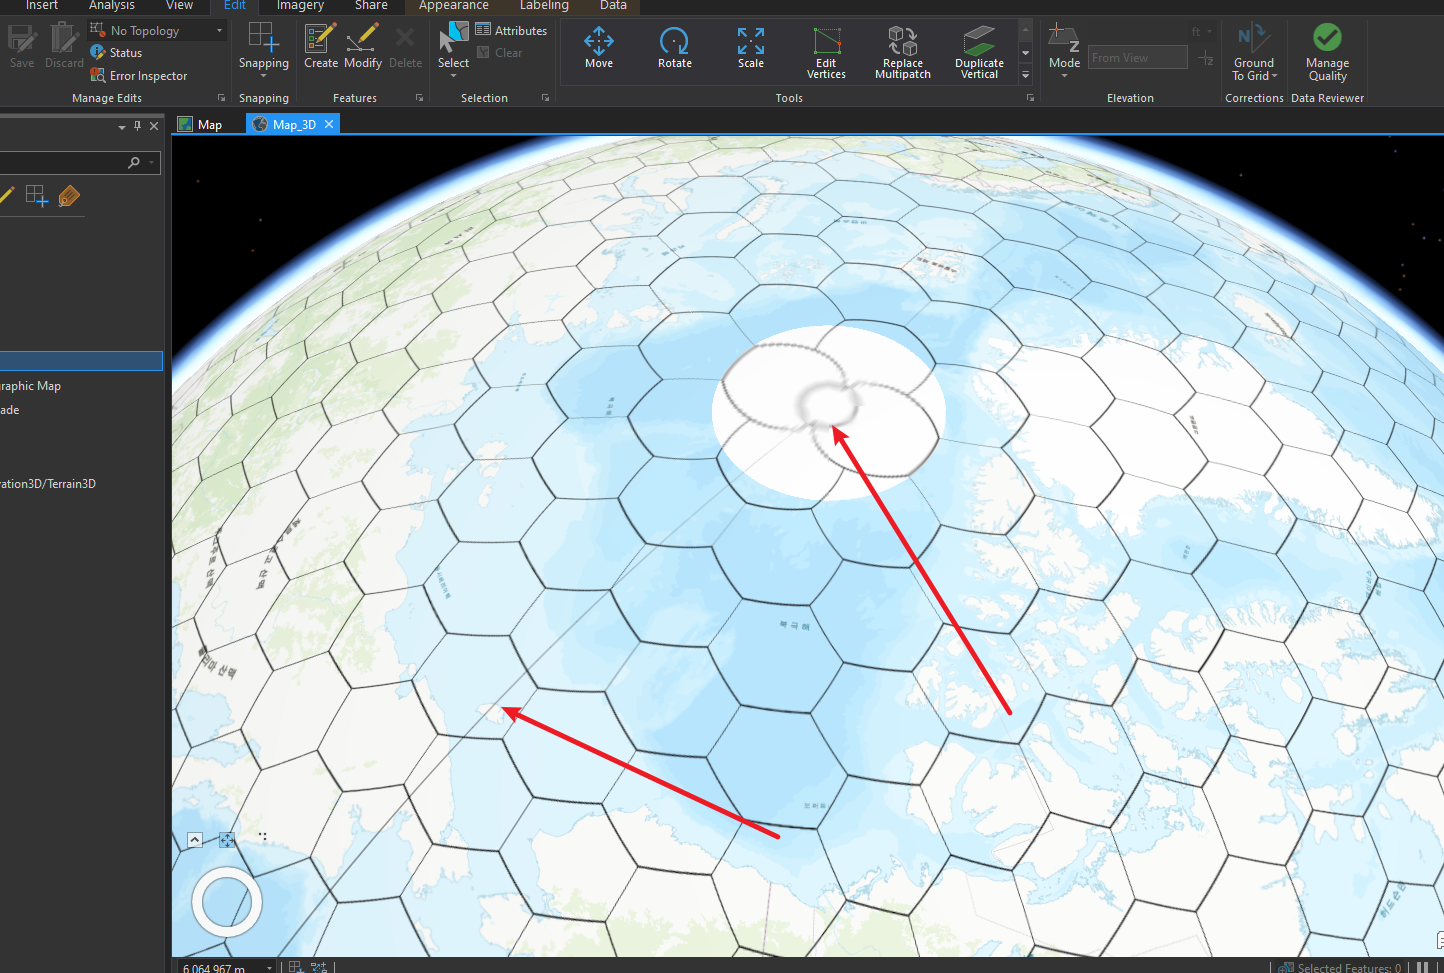 When I use shape for 3D map in ArcGIS pro, top and bottom are not correct and there are long line.
How to fix this issue?
When I use shape for 3D map in ArcGIS pro, top and bottom are not correct and there are long line.
How to fix this issue?