pyfolio
 pyfolio copied to clipboard
error in plot_drawdown_periods
if top is too big, will get error
pf.plot_drawdown_periods(returns, top=6)
AttributeError Traceback (most recent call last) d:\Users\Kan\Anaconda3\lib\site-packages\matplotlib\axis.py in convert_units(self, x) 1549 try: -> 1550 ret = self.converter.convert(x, self.units, self) 1551 except Exception as e:
d:\Users\Kan\Anaconda3\lib\site-packages\pandas\plotting_matplotlib\converter.py in convert(values, units, axis) 209 else: --> 210 values = PeriodConverter._convert_1d(values, units, axis) 211 return values
d:\Users\Kan\Anaconda3\lib\site-packages\pandas\plotting_matplotlib\converter.py in _convert_1d(values, units, axis) 228 elif isinstance(values, (list, tuple, np.ndarray, Index)): --> 229 return [get_datevalue(x, axis.freq) for x in values] 230 return values
d:\Users\Kan\Anaconda3\lib\site-packages\pandas\plotting_matplotlib\converter.py in
(.0) 228 elif isinstance(values, (list, tuple, np.ndarray, Index)): --> 229 return [get_datevalue(x, axis.freq) for x in values] 230 return values d:\Users\Kan\Anaconda3\lib\site-packages\pandas\plotting_matplotlib\converter.py in get_datevalue(date, freq) 236 elif isinstance(date, (str, datetime, pydt.date, pydt.time, np.datetime64)): --> 237 return Period(date, freq).ordinal 238 elif (
AttributeError: 'NaTType' object has no attribute 'ordinal'
The above exception was the direct cause of the following exception:
ConversionError Traceback (most recent call last)
in 1 plt.figure(figsize=(15,5)) ----> 2 pf.plot_drawdown_periods(returns, top=6) d:\Users\Kan\Anaconda3\lib\site-packages\pyfolio\plotting.py in plot_drawdown_periods(returns, top, ax, **kwargs) 444 lim[1], 445 alpha=.4, --> 446 color=colors[i]) 447 ax.set_ylim(lim) 448 ax.set_title('Top %i drawdown periods' % top)
d:\Users\Kan\Anaconda3\lib\site-packages\matplotlib_init_.py in inner(ax, data, *args, **kwargs) 1597 def inner(ax, *args, data=None, **kwargs): 1598 if data is None: -> 1599 return func(ax, *map(sanitize_sequence, args), **kwargs) 1600 1601 bound = new_sig.bind(ax, *args, **kwargs)
d:\Users\Kan\Anaconda3\lib\site-packages\matplotlib\axes_axes.py in fill_between(self, x, y1, y2, where, interpolate, step, **kwargs) 5230 5231 # Convert the arrays so we can work with them -> 5232 x = ma.masked_invalid(self.convert_xunits(x)) 5233 y1 = ma.masked_invalid(self.convert_yunits(y1)) 5234 y2 = ma.masked_invalid(self.convert_yunits(y2))
d:\Users\Kan\Anaconda3\lib\site-packages\matplotlib\artist.py in convert_xunits(self, x) 178 if ax is None or ax.xaxis is None: 179 return x --> 180 return ax.xaxis.convert_units(x) 181 182 def convert_yunits(self, y):
d:\Users\Kan\Anaconda3\lib\site-packages\matplotlib\axis.py in convert_units(self, x) 1551 except Exception as e: 1552 raise munits.ConversionError('Failed to convert value(s) to axis ' -> 1553 f'units: {x!r}') from e 1554 return ret 1555
ConversionError: Failed to convert value(s) to axis units: (NaT, Timestamp('2018-12-07 00:00:00+0000', tz='UTC', freq='D'))
Versions
- Pyfolio version: install from git, 2020-05-27
- Python version: 3.7.3
- Pandas version: 1.0.3
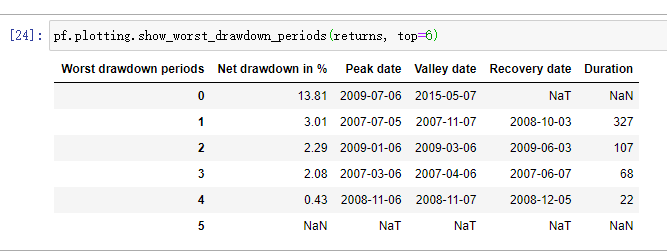
I did a lot of research and the source of the problem is from the function 'plot_drawdown_periods', Line number 403 in plotting.py in pyfolio. Specifically the line that is calculating the drawdown table 'df_drawdowns = timeseries.gen_drawdown_table(returns, top=top)'. Line number 432 in plotting.py in pyfolio.
While calculating the drawdowns, it has several NaT and nan values that are not able to convert into datetime and hence the error.
The quick fix is to use df_drawdowns.dropna() after calculating but that will create a problem in setting colors[i].
Appreciate the fix. I am trying to understand the function.
Found the fix. Don't process if the peak or recovery are NaT values. Change the for loop to the following. This is not a fix but just to suppress drawdowns for which we don't have peak/recovery values.
for i, (peak, recovery) in df_drawdowns[['Peak date', 'Recovery date']].iterrows():
    if not pd.isna(peak) and not pd.isna(recovery):
        if pd.isnull(recovery):
            recovery = returns.index[-1]
        ax.fill_between((peak, recovery),
                        lim[0],
                        lim[1],
                        alpha=.4,
                        color=colors[i])