qiskit-finance
 qiskit-finance copied to clipboard
BaseDataProvider total relative return
What is the expected enhancement?
Adds a new function to BaseDataProvider that returns the total relative change in an asset.
The Problem
In the get_period_return_mean_vector method, the average percentage change in the value of an asset per time step (daily) over the entire data set is returned. https://github.com/Qiskit/qiskit-finance/blob/main/qiskit_finance/data_providers/_base_data_provider.py#L113
However, I'm not sure if this is what is really desired.
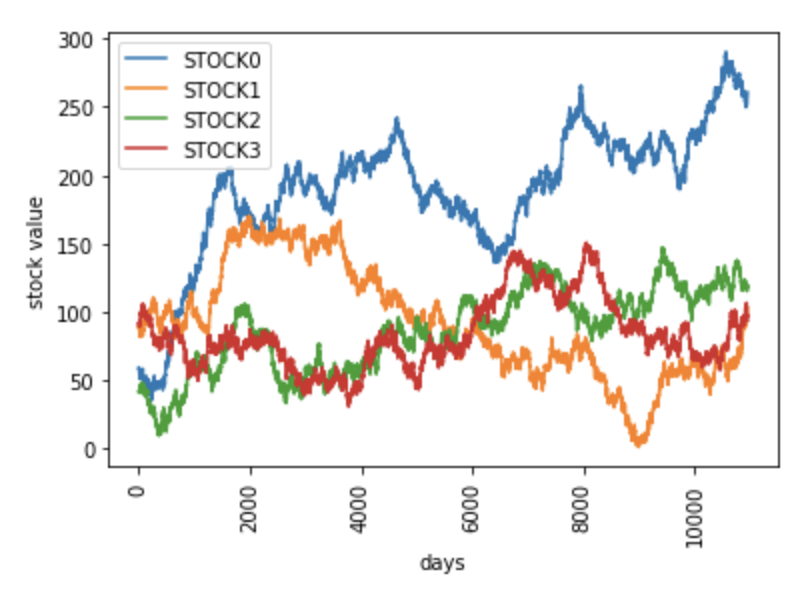
During the Fall 2021 Quantum Challenge the Qiskit Finance package was demonstrated in challenge notebook 1. In that demonstration there were four randomly generated stock prices generated over a 30 year period.
The values returned by get_period_return_mean_vector for these four stocks are
[1.59702144e-04 4.76518943e-04 2.39123234e-04 9.85029012e-05]
As you can see, STOCK1 has a larger mean return value than STOCK0: 4.76e-4 > 1.59e-4
However, looking at the chart of the value of the stock over the course of 30 years, STOCK0 has increased in relative value much more significantly than STOCK1. I would think that an investor would prefer STOCK0 over STOCK1. But using the get_period_return_mean_vector as the expected returns in the PortfolioOptimization class will cause the optimization to prefer STOCK1 even though it results in smaller return.
The values from get_period_return_mean_vector are affected by the fact that STOCK1 has a larger number of very small daily negative changes in value and a handful of large daily increases in value which skews the returned average value.
The Solution
Instead of get_period_return_mean_vector the BaseDataProvider object could have a method get_period_return_total_vector, which will simply be the relative increase in the value of the asset between the start and end of the period.
def get_period_return_total_vector(self) -> np.ndarray:
        """
        Returns a vector containing the total relative return of each asset over the entire period.
        Returns:
            a per-asset vector.
        Raises:
            QiskitFinanceError: no data loaded
        """
        try:
            if not self._data:
                raise QiskitFinanceError(
                    "No data loaded, yet. Please run the method run() first to load the data."
                )
        except AttributeError as ex:
            raise QiskitFinanceError(
                "No data loaded, yet. Please run the method run() first to load the data."
            ) from ex
        _div_func = np.vectorize(BaseDataProvider._divide)
        period_total_return = _div_func(np.array(self._data)[:, -1], np.array(self._data)[:, 0]) - 1
        self.period_total_return = cast(np.ndarray, period_total_return)
        return self.period_total_return
The returns from this function for the data above are
[3.39820122, 0.16965773, 1.84632666, 0.02657591]
One would then use these as the expected returns in the PortfolioOptimization class.
Hi, I had a doubt.
Could you please explain what did you exactly do in this line of code:
period_total_return = _div_func(np.array(self._data)[:, -1], np.array(self._data)[:, 0]) - 1
Did you directly subtract the values at the beginning and at the end of the data?
Also, I tried solving the aforementioned problem using the pyportfolioopt library, the expected annual return will be highest for a portfolio containing STOCK0 and STOCK2 (3.4%).

Sure, the line you're referring to computes the relative gain in the stock between day 0 and day N.
g =  (v_N - v_0 ) / v_0
g =  v_N/v_0 - 1
where v_i is the value of the stock on day i
In numpy, this is data[-1]/data[0] - 1
The function get_period_return_mean_vector returns the average of N-1 individual daily gains for each stock over the observed time period. This returned value, as you can see in the example above, suggests that STOCK1 has a higher return than STOCK0. But this is not true when you look at the plot of STOCK0 and STOCK1 over time. STOCK0 should be greater. Its final price is around $240 and it's initial price was about $60. Thus, the return for STOCK0 should be 300% or g ~= 3.
For STOCK1, its initial and final price are nearly equal and the gain should be near to zero g ~= 0.