Use indexed colormap
Hi,
Is there a way to use an indexed colormap with pyvista ?
My aim is to get a single colormap that matches rank/index in scalars to a solid color, but if the current mesh scalars histogram does not match the colormap, the display is flase...
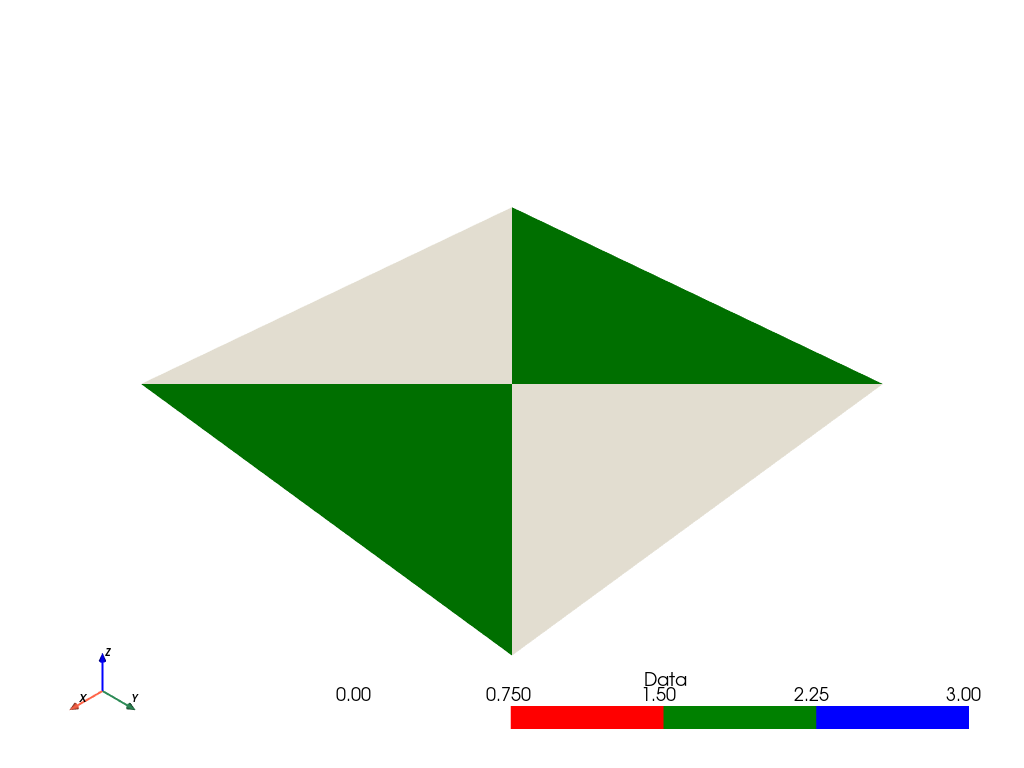
in the following example the last plot should display white and green triangles not white and blue ones ....
My only workaround is to manually remove the entries in the colormap based on np.unique(mesh["scalars"]) which is not so efficient with large arrays...
import numpy as np
import pyvista as pv
from matplotlib.colors import ListedColormap

points = np.array([
    [0,0,0],
    [1,0,0],
    [1,1,0],
    [0,1,0],
    [0.5,0.5,0]
])
cells = np.array(
    [
        3, 0, 1, 4,
        3, 1, 2, 4,
        3, 2, 3, 4,
        3, 3, 0, 4,
    ]
)

mesh = pv.PolyData(points, cells)
colormap = ListedColormap(["white", "red", "green", "blue"])

mesh.plot(scalars = np.array([0]*4), cmap = colormap)
mesh.plot(scalars = np.array([0,1,2,3]), cmap = colormap)
mesh.plot(scalars = np.array([1,2,3,0]), cmap = colormap)
mesh.plot(scalars = np.array([0,2,0,2]), cmap = colormap)
When providing a colormap, you have to set the clim as well to specify what range to map the colors. In the previous 3 examples, it worked out because you expect the colormat to be 0->white, 1->red, 2->green, 3->blue and they each have a min/max range of (0,3). The third example has a min/max range of (0,2) so the colormap is mapped to that range.
On the plot call, we map the range of the scalars to the colormap. For example, min:0->white and max:2->blue.
mesh["Data"] = np.array([0,2.1,0,2.1])
mesh.plot(cmap = colormap, clim=[0,3])
nice catch,
but in my case the real thing would be more like "holes" in scalars ranks such as:
mesh["Data"] = np.array([0, 2, 0, 3])
mesh["Data"] = np.array([1, 2, 1, 3])
or any possible combination
I have
- a lookup table that defines a RGB color for several ranks (integers) possibly in
[0, inf[, but possibly sparse (missing some integers between0andinf) - cell_arrays with ranks (integers) matching ones in the lut (necessarily present in the LUT) but not covering the whole LUT range
I might get something like a scalar array {3,5,6,7,15} with a LUT np.arange(0,25), how would i do that ?
simply using clim=[3,15] (or in a generic way clim = np.mimax(scalars))?