FCI L1c reader is single threaded
Describe the bug
While working on https://github.com/pytroll/satpy/pull/2182 and debugging the slow-down it caused, I noticed that the current implementation of fci_l1c_nc reader is single-threaded until the writing starts.
To Reproduce
import glob
import datetime as dt
import os
os.environ['DASK_NUM_WORKERS'] = "4"
os.environ['OMP_NUM_THREADS'] = "1"
os.environ['GDAL_NUM_THREADS'] = "4"
from satpy import Scene
from dask.diagnostics import ResourceProfiler, Profiler, CacheProfiler, visualize

def main():
    fnames = glob.glob(
        "/home/lahtinep/data/satellite/geo/fci_2022_uncompressed/RC0067/*nc"
    )
    comps = ["ir_105",]
    glbl = Scene(reader='fci_l1c_nc', filenames=fnames)
    glbl.load(comps, generate=False)

    lcl = glbl.resample("euron1", resampler="gradient_search", reduce_data=False)
    lcl.save_datasets(base_dir='/tmp/', tiled=True, blockxsize=512, blockysize=512, driver='COG', overviews=[])


if __name__ == "__main__":
    with Profiler() as prof, ResourceProfiler() as rprof, CacheProfiler() as cprof:
        main()
    visualize([rprof, prof, cprof],
              filename=dt.datetime.utcnow().strftime('/tmp/profile_fci_%Y%m%d_%H%M%S.html'),
              show=False)
Expected behavior
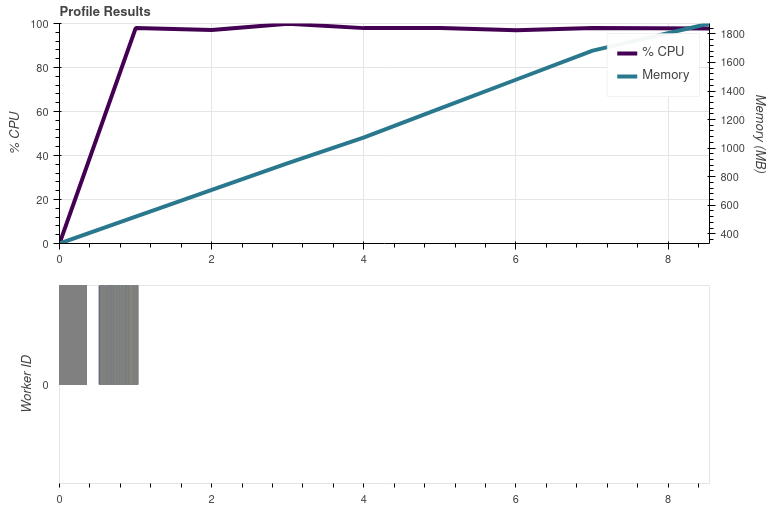
Adjusting the DASK_NUM_WORKERS variable should affect the CPU usage. In the above example, the CPU load should be around 400 % for most of the processing.
Actual results
Only the GDAL_NUM_THREADS variable has any effect. This would indicate that only the writing part is happening in parallel.
Screenshots

Environment Info:
- Satpy Version: current
main(https://github.com/pytroll/satpy/commit/acd074530f1eeaa860c1d18de22ecbfd75be8166) - Pyresample Version: 1.25.1 from conda-forge
- dask 2022.6.1
- xarray 2022.6.0
- numpy 1.22.4
The same is seen when loading a bunch (20) composites instead of the single one.
Instead of resampling and saving, doing
glbl['ir_105'].compute()
shows the same performance issue:
ABI processing is done in parallel, so at least it isn't the NetCDF C library that is stopping the parallel processing. And the FCI data are processed in single thread independent of the Python library (netCDF4 on main or h5netcdf in my PR #2182).
@pnuu did you have any time to look further into this? maybe @ameraner has an idea?
Sorry, I wouldn't really know where to look for either. Can we exclude that this is an issue with the base NetCDF4FileHandler, i.e. that this is specific to the FCI reader?
It looks like it's only the NetCDF4FileHandler. For example the abi_l1b reader, which is independent of this and uses XArray instead of using neither netCDF4 nor h5netcdfdirectly, is very much parallel.
If inside the file handler, or even the netcdf handlers __getitem__ method, you did data = data.persist() does it change the results? That should theoretically take out the netcdf utility's usage of the file from the equation.
Another thought I had is is the compression used by these files a new/non-traditional algorithm that may have code that is locking or isn't unlocking something when it should be?
One more thought: could there be a dask array used as one of the xarray coordinates that is being used in a calculation and forcing everything to a single chunk?
@pnuu could you comment here what version of the netcdf python and C libraries you have installed?
h5netcdf 1.0.2 pyhd8ed1ab_0 conda-forge libnetcdf 4.8.1 nompi_h329d8a1_102 conda-forge netcdf4 1.6.0 nompi_py39hf5a3a3f_100 conda-forge
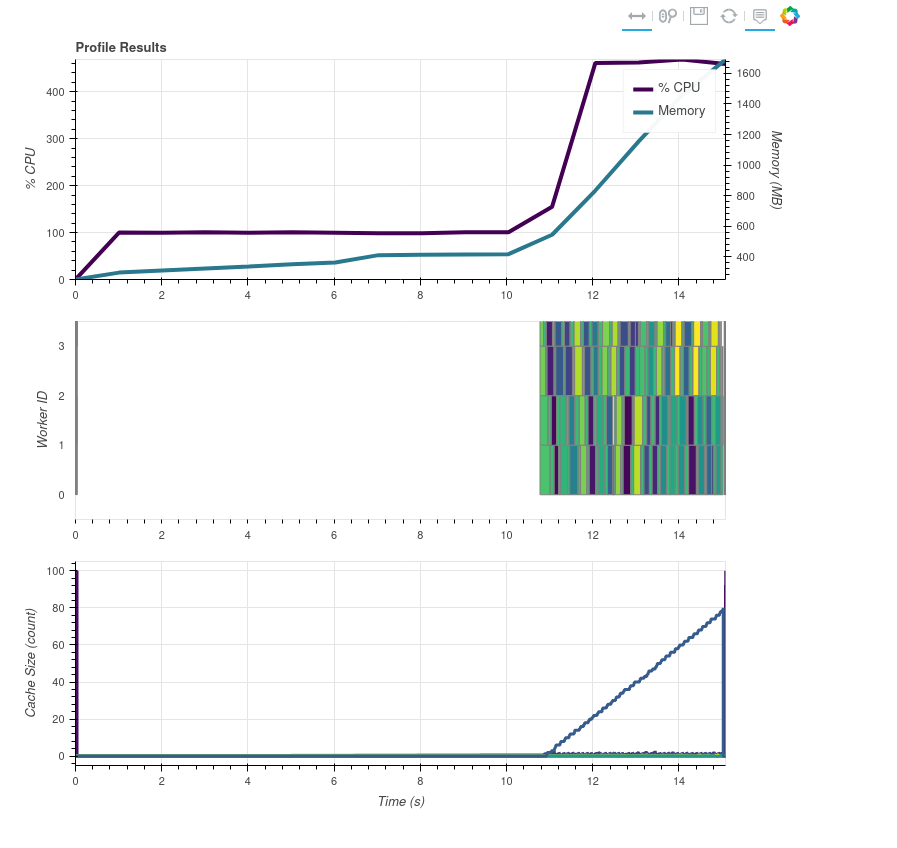
I tried this (second variant, just computing the channel without saving or resampling) and seem to get something multithreaded.
 Note this is on compressed FCI data. Same versions of libnetcdf and netcdf4.
Can someone give me some FCI data to play with? I tested @pnuu's original script with VIIRS L1b data which uses the same utility class and don't see any single-threaded behavior. I'll try a few different things with the VIIRS data and see if I can recreate a single-threaded CPU usage.
Doing:
    def __init__(self, filename, filename_info, filetype_info,
                 auto_maskandscale=False, xarray_kwargs=None,
                 cache_var_size=0, cache_handle=False):
        """Initialize object."""
        cache_var_size = 10000
        cache_handle = True
in the netcdf helper class changes the chunk size a ton. I go from:
((2048, 2048, 1184, 1184), (6400,))
to:
((6464,), (6400,))
This may be the bug @ameraner pointed out. Note that with this new chunk size I hover around 100% CPU usage. Here's my script:
import glob
import datetime as dt
import os
os.environ['DASK_NUM_WORKERS'] = "4"
os.environ['OMP_NUM_THREADS'] = "1"
os.environ['GDAL_NUM_THREADS'] = "4"
from satpy import Scene
from dask.diagnostics import ResourceProfiler, Profiler, CacheProfiler, visualize

def main():
    fnames = glob.glob("/data/satellite/viirs_l1b/2017345/*.nc")
    comps = ["I04",]
    glbl = Scene(reader='viirs_l1b', filenames=fnames)
    glbl.load(comps, generate=False)
    print(glbl["I04"].chunks)
    glbl["I04"].compute()


if __name__ == "__main__":
    with Profiler() as prof, ResourceProfiler(0.1) as rprof, CacheProfiler() as cprof:
        main()
    visualize([rprof, prof, cprof],
              filename=dt.datetime.utcnow().strftime('/tmp/profile_viirs_l1b_%Y%m%d_%H%M%S.html'),
              show=False)
This fixed this issue for me for VIIRS L1b, but it sounds like this isn't the problem with FCI data since you already have multiple files being loaded and should still see multiple workers being used:
$ git diff ~/repos/git/satpy/satpy/readers/netcdf_utils.py
diff --git a/satpy/readers/netcdf_utils.py b/satpy/readers/netcdf_utils.py
index 40beb21cf..baddce807 100644
--- a/satpy/readers/netcdf_utils.py
+++ b/satpy/readers/netcdf_utils.py
@@ -92,6 +92,8 @@ class NetCDF4FileHandler(BaseFileHandler):
                  auto_maskandscale=False, xarray_kwargs=None,
                  cache_var_size=0, cache_handle=False):
         """Initialize object."""
+        cache_var_size = 10000
+        cache_handle = True
         super(NetCDF4FileHandler, self).__init__(
             filename, filename_info, filetype_info)
         self.file_content = {}
@@ -273,7 +275,7 @@ class NetCDF4FileHandler(BaseFileHandler):
             g = self.file_handle[group]
         v = g[key]
         x = xr.DataArray(
-                da.from_array(v), dims=v.dimensions, attrs=v.__dict__,
+                da.from_array(v, chunks=self._xarray_kwargs["chunks"]), dims=v.dimensions, attrs=v.__dict__,
                 name=v.name)
         return x
Test data are available from here: https://sftp.eumetsat.int/public/folder/UsCVknVOOkSyCdgpMimJNQ/User-Materials/Test-Data/MTG/MTG_FCI_L1C_SpectrallyRepresentative_TD-360_May2022/
I tried this (second variant, just computing the channel without saving or resampling) and seem to get something multithreaded.
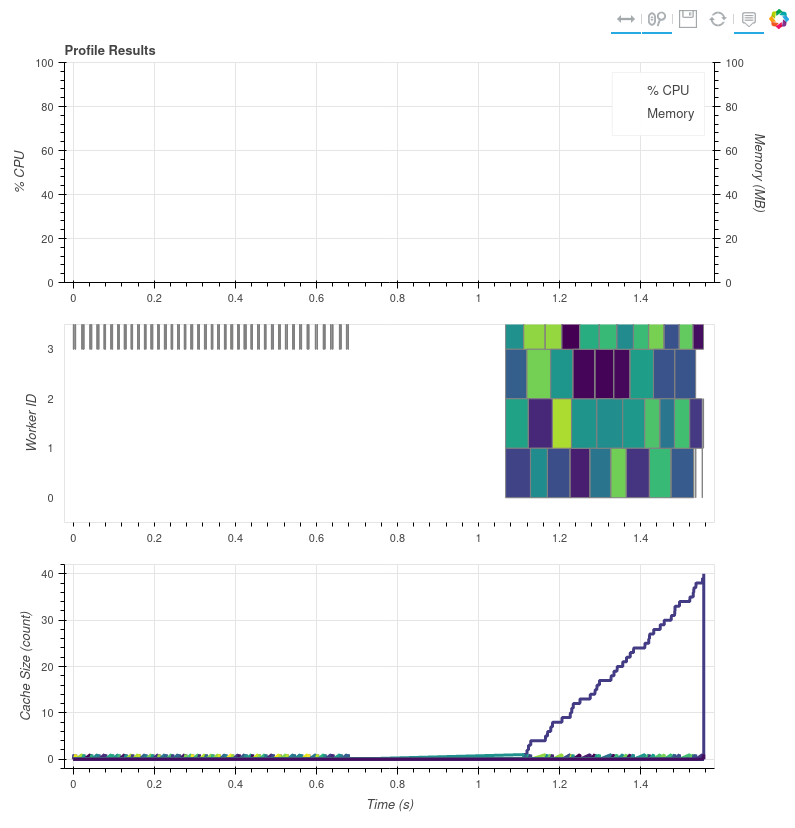
I think the plot is missing most of it. For me it took 8.766.. seconds to complete the whole script. This is what I got with glbl['ir_105'].compute():
The beginning looks the same.
oh, ok. Yeah, since I can't get the resource profiler to plot anything, it's difficult for me to see.
@pnuu @mraspaud can you both try turning off caching in the file handler? I know @pnuu said he tried it, but I'm getting an error that makes it seem like you didn't :wink:
I manually edited the netcdf_utils.py file to look like this:
    def __init__(self, filename, filename_info, filetype_info,
                 auto_maskandscale=False, xarray_kwargs=None,
                 cache_var_size=0, cache_handle=False):
        """Initialize object."""
        cache_var_size = 0
        cache_handle = False
That is, force cache var size and cache_handle to their defaults. When I run this with the below script I get this error:
Could not load dataset 'DataID(name='ir_105', wavelength=WavelengthRange(min=9.8, central=10.5, max=11.2, unit='µm'), resolution=2000, calibration=<calibration.brightness_temperature>, modifiers=())': unable to decode time units 'seconds since 2000-01-01 00:00:00.0' with 'the default calendar'. Try opening your dataset with decode_times=False or installing cftime if it is not installed.
Traceback (most recent call last):
  File "/home/davidh/miniconda3/envs/satpy_py39/lib/python3.9/site-packages/xarray/coding/times.py", line 261, in decode_cf_datetime
    dates = _decode_datetime_with_pandas(flat_num_dates, units, calendar)
  File "/home/davidh/miniconda3/envs/satpy_py39/lib/python3.9/site-packages/xarray/coding/times.py", line 217, in _decode_datetime_with_pandas
    pd.to_timedelta(flat_num_dates.min(), delta) + ref_date
  File "/home/davidh/miniconda3/envs/satpy_py39/lib/python3.9/site-packages/pandas/core/tools/timedeltas.py", line 148, in to_timedelta
    return _coerce_scalar_to_timedelta_type(arg, unit=unit, errors=errors)
  File "/home/davidh/miniconda3/envs/satpy_py39/lib/python3.9/site-packages/pandas/core/tools/timedeltas.py", line 156, in _coerce_scalar_to_timedelta_type
    result = Timedelta(r, unit)
  File "pandas/_libs/tslibs/timedeltas.pyx", line 1357, in pandas._libs.tslibs.timedeltas.Timedelta.__new__
  File "pandas/_libs/tslibs/timedeltas.pyx", line 294, in pandas._libs.tslibs.timedeltas.convert_to_timedelta64
  File "pandas/_libs/tslibs/conversion.pyx", line 121, in pandas._libs.tslibs.conversion.cast_from_unit
OverflowError: Python int too large to convert to C long

During handling of the above exception, another exception occurred:

Traceback (most recent call last):
  File "/home/davidh/miniconda3/envs/satpy_py39/lib/python3.9/site-packages/xarray/coding/times.py", line 174, in _decode_cf_datetime_dtype
    result = decode_cf_datetime(example_value, units, calendar, use_cftime)
  File "/home/davidh/miniconda3/envs/satpy_py39/lib/python3.9/site-packages/xarray/coding/times.py", line 263, in decode_cf_datetime
    dates = _decode_datetime_with_cftime(
  File "/home/davidh/miniconda3/envs/satpy_py39/lib/python3.9/site-packages/xarray/coding/times.py", line 195, in _decode_datetime_with_cftime
    cftime.num2date(num_dates, units, calendar, only_use_cftime_datetimes=True)
  File "src/cftime/_cftime.pyx", line 586, in cftime._cftime.num2date
  File "src/cftime/_cftime.pyx", line 385, in cftime._cftime.cast_to_int
OverflowError: time values outside range of 64 bit signed integers
Here's my script:
import glob
import datetime as dt
import os
import sys
os.environ['DASK_NUM_WORKERS'] = "4"
os.environ['OMP_NUM_THREADS'] = "1"
os.environ['GDAL_NUM_THREADS'] = "4"
from satpy import Scene
import dask.array as da
from dask.diagnostics import ResourceProfiler, Profiler, CacheProfiler, visualize

class PassThru:
    def __setitem__(self, key, val):
        pass

def main():
    fnames = sys.argv[1:]
    comps = ["ir_105",]
    glbl = Scene(reader='fci_l1c_nc', filenames=fnames)
    glbl.load(comps, generate=False)
    print(glbl["ir_105"].chunks)
    #glbl["ir_105"].compute()
    da.store([glbl["ir_105"].data], [PassThru()], lock=False)

    #lcl = glbl.resample("euron1", resampler="gradient_search", reduce_data=False)
    #lcl.save_datasets(base_dir='/tmp/', tiled=True, blockxsize=512, blockysize=512, driver='COG', overviews=[])


if __name__ == "__main__":
    with Profiler() as prof, ResourceProfiler(0.1) as rprof, CacheProfiler() as cprof:
        main()
    visualize([rprof, prof, cprof],
              filename=dt.datetime.utcnow().strftime('/tmp/profile_fci_%Y%m%d_%H%M%S.html'),
              show=False)
And if I keep the cache size to 0 but enable handle caching then I get:
  File "/home/davidh/repos/git/satpy/satpy/readers/yaml_reader.py", line 1385, in _extract_segment_location_dicts
    self._initialise_segment_infos(filetype, filetype_fhs)
  File "/home/davidh/repos/git/satpy/satpy/readers/yaml_reader.py", line 1399, in _initialise_segment_infos
    width_to_grid_type = _get_width_to_grid_type(filetype_fhs[0].get_segment_position_info())
  File "/home/davidh/repos/git/satpy/satpy/readers/fci_l1c_nc.py", line 213, in get_segment_position_info
    '1km': {'start_position_row': self['data/vis_04/measured/start_position_row'].item(),
  File "/home/davidh/miniconda3/envs/satpy_py39/lib/python3.9/site-packages/xarray/core/ops.py", line 202, in func
    return _call_possibly_missing_method(self.data, name, args, kwargs)
  File "/home/davidh/miniconda3/envs/satpy_py39/lib/python3.9/site-packages/xarray/core/ops.py", line 192, in _call_possibly_missing_method
    duck_array_ops.fail_on_dask_array_input(arg, func_name=name)
  File "/home/davidh/miniconda3/envs/satpy_py39/lib/python3.9/site-packages/xarray/core/duck_array_ops.py", line 59, in fail_on_dask_array_input
    raise NotImplementedError(msg % func_name)
NotImplementedError: 'item' is not yet a valid method on dask arrays
FYI doing .persist() inside the file handler doesn't seem to do anything as far as CPU usage which remains hovering around 100%. This made me wonder/realize that maybe the work being done is just so "simple" that it doesn't actually need more than one CPU at a time.
New separate thought: maybe we can/should cache the xarray Dataset objects for each group...eh nevermind xarray is probably already caching the open file object so that maybe isn't an issue.
I'm playing around with hacking some map_blocks calls and leaving OMP threads at 4 (in case numpy operations use OMP and would use multiple threads), and something odd is going on:
I counted and added print statements and my synthetic map_blocks usage is definitely happening at the last ~5 seconds of the processing, but the task stream shows it all at the beginning.
If I set only cache_var_size = 0, I get this:
Traceback (most recent call last):
  File "/home/lahtinep/mambaforge/envs/pytroll/lib/python3.9/site-packages/xarray/core/ops.py", line 191, in _call_possibly_missing_method
    method = getattr(arg, name)
AttributeError: 'Array' object has no attribute 'item'

During handling of the above exception, another exception occurred:

Traceback (most recent call last):
  File "/home/lahtinep/bin/test_fci.py", line 86, in <module>
    main()
  File "/home/lahtinep/bin/test_fci.py", line 71, in main
    glbl = Scene(reader='fci_l1c_nc', filenames=fnames)
  File "/home/lahtinep/Software/pytroll/pytroll_packages/satpy/satpy/scene.py", line 133, in __init__
    self._readers = self._create_reader_instances(filenames=filenames,
  File "/home/lahtinep/Software/pytroll/pytroll_packages/satpy/satpy/scene.py", line 154, in _create_reader_instances
    return load_readers(filenames=filenames,
  File "/home/lahtinep/Software/pytroll/pytroll_packages/satpy/satpy/readers/__init__.py", line 570, in load_readers
    reader_instance.create_filehandlers(
  File "/home/lahtinep/Software/pytroll/pytroll_packages/satpy/satpy/readers/yaml_reader.py", line 1379, in create_filehandlers
    self._extract_segment_location_dicts(created_fhs)
  File "/home/lahtinep/Software/pytroll/pytroll_packages/satpy/satpy/readers/yaml_reader.py", line 1385, in _extract_segment_location_dicts
    self._initialise_segment_infos(filetype, filetype_fhs)
  File "/home/lahtinep/Software/pytroll/pytroll_packages/satpy/satpy/readers/yaml_reader.py", line 1399, in _initialise_segment_infos
    width_to_grid_type = _get_width_to_grid_type(filetype_fhs[0].get_segment_position_info())
  File "/home/lahtinep/Software/pytroll/pytroll_packages/satpy/satpy/readers/fci_l1c_nc.py", line 213, in get_segment_position_info
    '1km': {'start_position_row': self['data/vis_04/measured/start_position_row'].item(),
  File "/home/lahtinep/mambaforge/envs/pytroll/lib/python3.9/site-packages/xarray/core/ops.py", line 203, in func
    return _call_possibly_missing_method(self.data, name, args, kwargs)
  File "/home/lahtinep/mambaforge/envs/pytroll/lib/python3.9/site-packages/xarray/core/ops.py", line 193, in _call_possibly_missing_method
    duck_array_ops.fail_on_dask_array_input(arg, func_name=name)
  File "/home/lahtinep/mambaforge/envs/pytroll/lib/python3.9/site-packages/xarray/core/duck_array_ops.py", line 61, in fail_on_dask_array_input
    raise NotImplementedError(msg % func_name)
NotImplementedError: 'item' is not yet a valid method on dask arrays
If I set only cache_handle = False, the processing works but is (still) single-threaded.
If I set cache_var_size = 0 and cache_handle = False, I get this:
Could not load dataset 'DataID(name='ir_105', wavelength=WavelengthRange(min=9.8, central=10.5, max=11.2, unit='µm'), resolution=2000, calibration=<calibration.brightness_temperature>, modifiers=())': unable to decode time units 'seconds since 2000-01-01 00:00:00.0' with 'the default calendar'. Try opening your dataset with decode_times=False or installing cftime if it is not installed.
Traceback (most recent call last):
  File "/home/lahtinep/mambaforge/envs/pytroll/lib/python3.9/site-packages/xarray/coding/times.py", line 270, in decode_cf_datetime
    dates = _decode_datetime_with_pandas(flat_num_dates, units, calendar)
  File "/home/lahtinep/mambaforge/envs/pytroll/lib/python3.9/site-packages/xarray/coding/times.py", line 223, in _decode_datetime_with_pandas
    pd.to_timedelta(flat_num_dates.min(), delta) + ref_date
  File "/home/lahtinep/mambaforge/envs/pytroll/lib/python3.9/site-packages/pandas/core/tools/timedeltas.py", line 148, in to_timedelta
    return _coerce_scalar_to_timedelta_type(arg, unit=unit, errors=errors)
  File "/home/lahtinep/mambaforge/envs/pytroll/lib/python3.9/site-packages/pandas/core/tools/timedeltas.py", line 156, in _coerce_scalar_to_timedelta_type
    result = Timedelta(r, unit)
  File "pandas/_libs/tslibs/timedeltas.pyx", line 1357, in pandas._libs.tslibs.timedeltas.Timedelta.__new__
  File "pandas/_libs/tslibs/timedeltas.pyx", line 294, in pandas._libs.tslibs.timedeltas.convert_to_timedelta64
  File "pandas/_libs/tslibs/conversion.pyx", line 121, in pandas._libs.tslibs.conversion.cast_from_unit
OverflowError: Python int too large to convert to C long

During handling of the above exception, another exception occurred:

Traceback (most recent call last):
  File "/home/lahtinep/mambaforge/envs/pytroll/lib/python3.9/site-packages/xarray/coding/times.py", line 180, in _decode_cf_datetime_dtype
    result = decode_cf_datetime(example_value, units, calendar, use_cftime)
  File "/home/lahtinep/mambaforge/envs/pytroll/lib/python3.9/site-packages/xarray/coding/times.py", line 272, in decode_cf_datetime
    dates = _decode_datetime_with_cftime(
  File "/home/lahtinep/mambaforge/envs/pytroll/lib/python3.9/site-packages/xarray/coding/times.py", line 201, in _decode_datetime_with_cftime
    cftime.num2date(num_dates, units, calendar, only_use_cftime_datetimes=True)
  File "src/cftime/_cftime.pyx", line 586, in cftime._cftime.num2date
  File "src/cftime/_cftime.pyx", line 385, in cftime._cftime.cast_to_int
OverflowError: time values outside range of 64 bit signed integers

During handling of the above exception, another exception occurred:

Traceback (most recent call last):
  File "/home/lahtinep/Software/pytroll/pytroll_packages/satpy/satpy/readers/yaml_reader.py", line 847, in _load_dataset_with_area
    ds = self._load_dataset_data(file_handlers, dsid, **kwargs)
  File "/home/lahtinep/Software/pytroll/pytroll_packages/satpy/satpy/readers/yaml_reader.py", line 719, in _load_dataset_data
    proj = self._load_dataset(dsid, ds_info, file_handlers, **kwargs)
  File "/home/lahtinep/Software/pytroll/pytroll_packages/satpy/satpy/readers/yaml_reader.py", line 1179, in _load_dataset
    _find_missing_segments(file_handlers, ds_info, dsid)
  File "/home/lahtinep/Software/pytroll/pytroll_packages/satpy/satpy/readers/yaml_reader.py", line 1333, in _find_missing_segments
    projectable = fh.get_dataset(dsid, ds_info)
  File "/home/lahtinep/Software/pytroll/pytroll_packages/satpy/satpy/readers/fci_l1c_nc.py", line 237, in get_dataset
    return self._get_dataset_measurand(key, info=info)
  File "/home/lahtinep/Software/pytroll/pytroll_packages/satpy/satpy/readers/fci_l1c_nc.py", line 311, in _get_dataset_measurand
    res.attrs.update(self.orbital_param)
  File "/home/lahtinep/mambaforge/envs/pytroll/lib/python3.9/functools.py", line 993, in __get__
    val = self.func(instance)
  File "/home/lahtinep/Software/pytroll/pytroll_packages/satpy/satpy/readers/fci_l1c_nc.py", line 318, in orbital_param
    actual_subsat_lon = float(np.nanmean(self._get_aux_data_lut_vector('subsatellite_longitude')))
  File "/home/lahtinep/Software/pytroll/pytroll_packages/satpy/satpy/readers/fci_l1c_nc.py", line 359, in _get_aux_data_lut_vector
    lut = self[AUX_DATA[aux_data_name]]
  File "/home/lahtinep/Software/pytroll/pytroll_packages/satpy/satpy/readers/netcdf_utils.py", line 222, in __getitem__
    return self._get_variable(key, val)
  File "/home/lahtinep/Software/pytroll/pytroll_packages/satpy/satpy/readers/netcdf_utils.py", line 242, in _get_variable
    val = self._get_var_from_xr(group, key)
  File "/home/lahtinep/Software/pytroll/pytroll_packages/satpy/satpy/readers/netcdf_utils.py", line 254, in _get_var_from_xr
    with xr.open_dataset(self.filename, group=group,
  File "/home/lahtinep/mambaforge/envs/pytroll/lib/python3.9/site-packages/xarray/backends/api.py", line 531, in open_dataset
    backend_ds = backend.open_dataset(
  File "/home/lahtinep/mambaforge/envs/pytroll/lib/python3.9/site-packages/xarray/backends/netCDF4_.py", line 569, in open_dataset
    ds = store_entrypoint.open_dataset(
  File "/home/lahtinep/mambaforge/envs/pytroll/lib/python3.9/site-packages/xarray/backends/store.py", line 29, in open_dataset
    vars, attrs, coord_names = conventions.decode_cf_variables(
  File "/home/lahtinep/mambaforge/envs/pytroll/lib/python3.9/site-packages/xarray/conventions.py", line 521, in decode_cf_variables
    new_vars[k] = decode_cf_variable(
  File "/home/lahtinep/mambaforge/envs/pytroll/lib/python3.9/site-packages/xarray/conventions.py", line 369, in decode_cf_variable
    var = times.CFDatetimeCoder(use_cftime=use_cftime).decode(var, name=name)
  File "/home/lahtinep/mambaforge/envs/pytroll/lib/python3.9/site-packages/xarray/coding/times.py", line 682, in decode
    dtype = _decode_cf_datetime_dtype(data, units, calendar, self.use_cftime)
  File "/home/lahtinep/mambaforge/envs/pytroll/lib/python3.9/site-packages/xarray/coding/times.py", line 190, in _decode_cf_datetime_dtype
    raise ValueError(msg)
ValueError: unable to decode time units 'seconds since 2000-01-01 00:00:00.0' with 'the default calendar'. Try opening your dataset with decode_times=False or installing cftime if it is not installed.
Traceback (most recent call last):
  File "/home/lahtinep/Software/pytroll/pytroll_packages/satpy/satpy/dataset/data_dict.py", line 169, in __getitem__
    return super(DatasetDict, self).__getitem__(item)
KeyError: 'ir_105'

During handling of the above exception, another exception occurred:

Traceback (most recent call last):
  File "/home/lahtinep/bin/test_fci.py", line 86, in <module>
    main()
  File "/home/lahtinep/bin/test_fci.py", line 74, in main
    glbl['ir_105'].compute()
  File "/home/lahtinep/Software/pytroll/pytroll_packages/satpy/satpy/scene.py", line 803, in __getitem__
    return self._datasets[key]
  File "/home/lahtinep/Software/pytroll/pytroll_packages/satpy/satpy/dataset/data_dict.py", line 171, in __getitem__
    key = self.get_key(item)
  File "/home/lahtinep/Software/pytroll/pytroll_packages/satpy/satpy/dataset/data_dict.py", line 158, in get_key
    return get_key(match_key, self.keys(), num_results=num_results,
  File "/home/lahtinep/Software/pytroll/pytroll_packages/satpy/satpy/dataset/data_dict.py", line 107, in get_key
    raise KeyError("No dataset matching '{}' found".format(str(key)))
KeyError: "No dataset matching 'DataQuery(name='ir_105')' found"
Ok so I would consider that a bug and I think something @ameraner and @gerritholl and I talked about (the netcdf utility returning a dask array or an xarray DataArray depending on what caching you're using).
Either way, I'm starting to think that either the processing being done in our tests is not complex enough to show multi-threaded-ness or the GEOVariableSegmentYAMLReader reader class (the one that uses the file handler) is doing something that is causing the single threaded behavior.
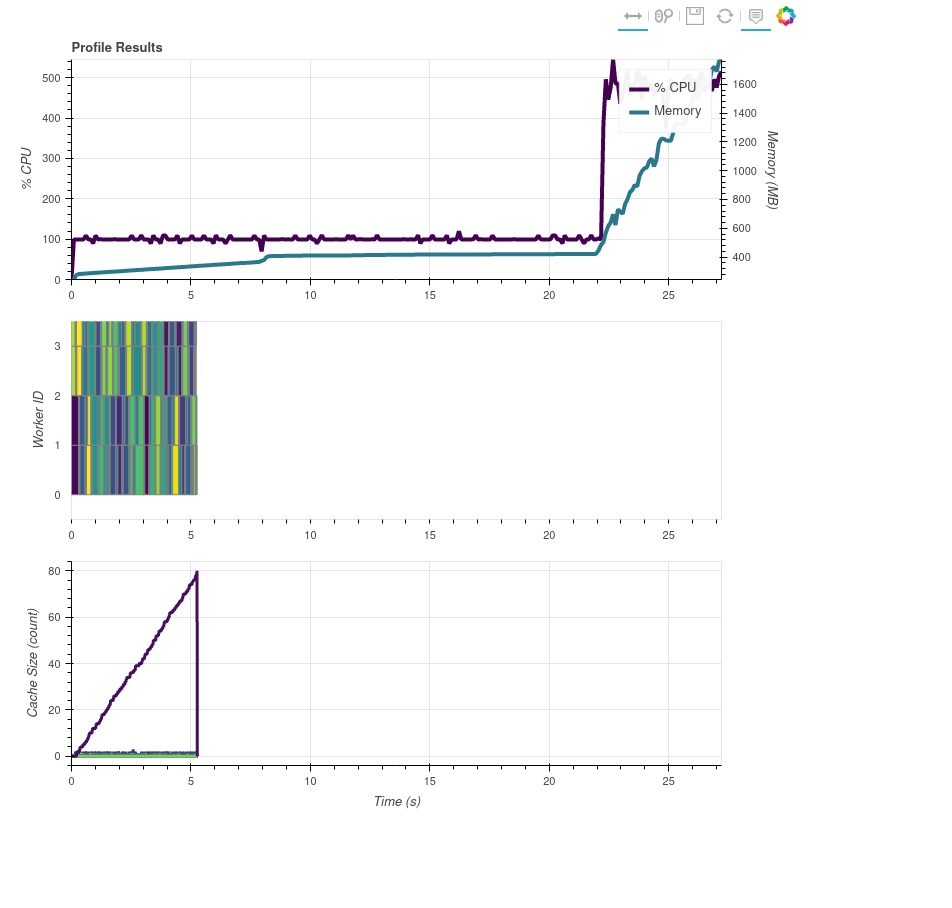
This is what I get with 20 composites, some of which are day/night combinations:
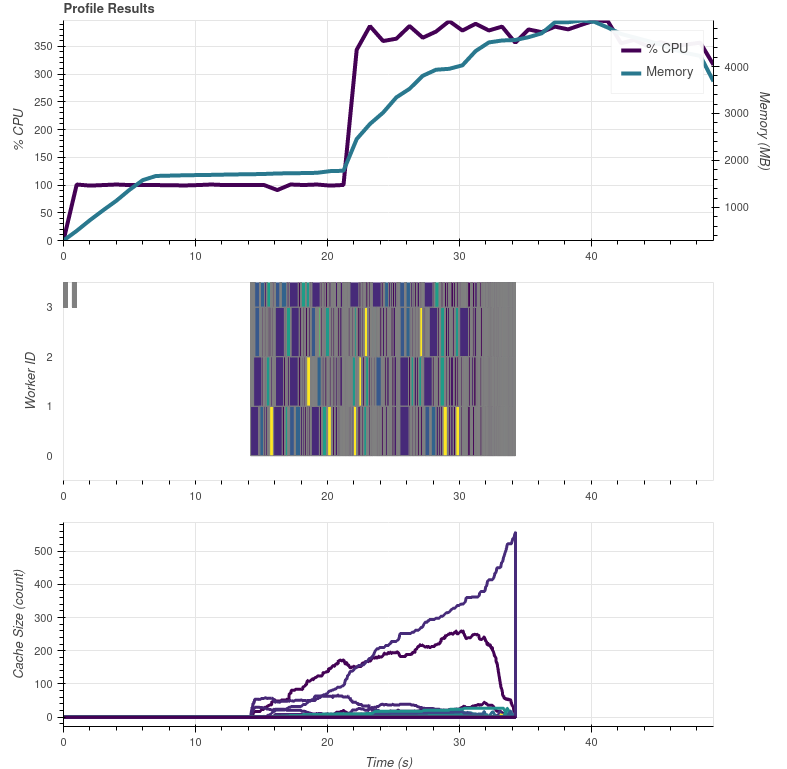
The tasks in the graph are mostly gradient search, but there are also some which are from colorizing. So could the flat 100 % CPU usage in the beginning be purely the metadata reading?
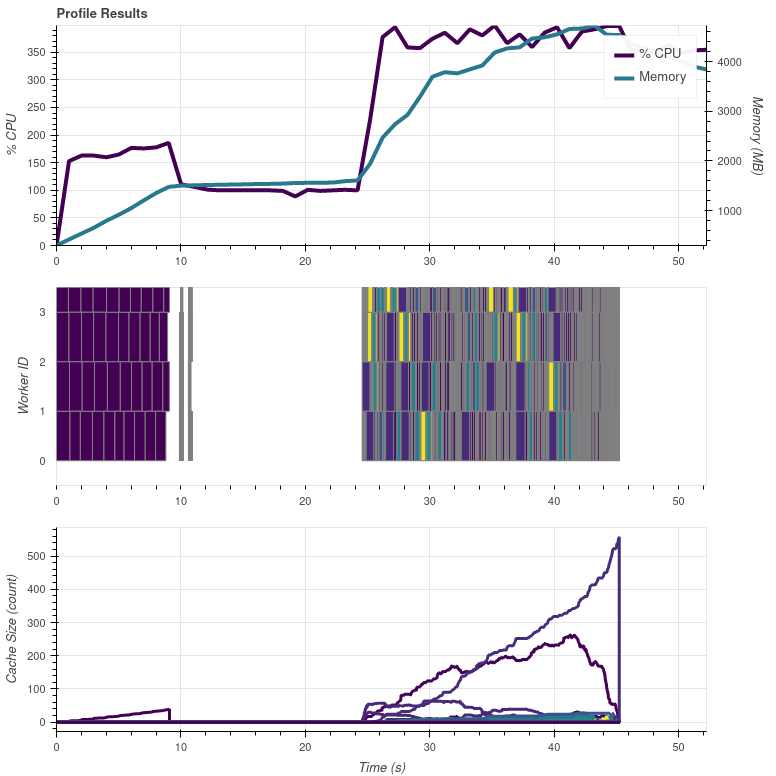
Ok I think I've found a bug in dask's diagnostics tools. They assume that when they __enter__ their context managers that dask computation has started. So in my case it was putting all the dask stuff at the beginning even though they didn't actually start until the end of the execution. So I've added a couple things to my script to fix this. First, here is the correct graph:
What I've done:
- Modified the utility handler to cache small vars (
cache_var_size = 10000, this is what is inmain) but not cache the file handlecache_handle = False. - Modified
get_datasetin the reader to have a print statement with the key being loaded and the current UTC time in eachifbranch to make sure I knew what was being loaded and when. I also modified_get_dataset_measurandto return theDataArrayalmost immediately to avoid any weird issues that may be resulting from the masking/valid_range/fill stuff, the calibration stuff, and the other metadata things. I modifiedorbital_paramto return{}to avoid any logic that might be doing. Lastly I modifiedcalc_area_extentto return fake extents so make sure that the extent calculations weren't doing anything weird. - I updated my script to look like the below. The key points are
sleepy_processingbeing called bymap_blockswhich adds a known "difficult" computation that should take more than one thread. I called it sleepy because at first it was just running atime.sleepbut :man_facepalming: sleep doesn't using any CPU on most platforms. Besides the prints, the next most important thing is theda.random.randomcomputes which make sure there is a dask task at the beginning and the end of the profiling results to "scale" the graphs above to the proper ranges.
New Script
import datetime as dt
import os
import sys

os.environ['DASK_NUM_WORKERS'] = "4"
os.environ['OMP_NUM_THREADS'] = "4"
os.environ['GDAL_NUM_THREADS'] = "4"
from satpy import Scene
import dask
import dask.array as da
import numpy as np
from dask.diagnostics import ResourceProfiler, Profiler, CacheProfiler, visualize

class PassThru:
    def __setitem__(self, key, val):
        print("setitem")
        pass


def sleepy_processing(data_chunk):
    big_shape = (1000, 1000)
    a = np.random.random(big_shape)
    b = np.random.random(big_shape[::-1])
    np.dot(a, b)
    print(dt.datetime.utcnow().isoformat(), "In sleepy")
    return data_chunk


def main():
    fnames = sys.argv[1:]
    comps = ["ir_105",]
    glbl = Scene(reader='fci_l1c_nc', filenames=fnames)
    glbl.load(comps, generate=False)
    print(glbl["ir_105"].chunks)
    data = glbl["ir_105"].data
    new_data = da.map_blocks(sleepy_processing, data, meta=np.array((), dtype=data.dtype), dtype=data.dtype, chunks=data.chunks)
    da.store([new_data], [PassThru()], lock=False)


if __name__ == "__main__":
    print(dt.datetime.utcnow(), "Script started")
    with Profiler() as prof, ResourceProfiler() as rprof, CacheProfiler() as cprof, dask.config.set({"optimization.fuse.active": False}):
        da.random.random((100, 100), chunks=10).compute()
        print(dt.datetime.utcnow(), "Main about to be called")
        main()
        print(dt.datetime.utcnow(), "Main done")
        da.random.random((100, 100), chunks=10).compute()
    print("After main func: ", dt.datetime.utcnow().isoformat())
    filename = dt.datetime.utcnow().strftime('/tmp/profile_fci_%Y%m%d_%H%M%S.html')
    visualize([rprof, prof, cprof],
              filename=filename,
              show=False)
    print(f"file://{filename}")
- Finally, the time information from my print statements combined with running my script as
time python profile_fci.pyshow: a. 18.277s total script time b. "if name" block starts ~2 seconds after script is started. I think this is due to import time of satpy and all its dependencies. c. It takes about 7 seconds to load the file handlers (not callingget_datasetyet) d. It takes about 3-4 seconds to callget_dataseton every file handler. e. It takes about 4 seconds from the first "sleepy" task executing to the last one. f. ~15s to call themainfunction from start to finish g. The "sleepy" tasks print out coincide with the start of the dask tasks in the graphs above.
Conclusion
The single threaded CPU usage consists of two things:
- Scene creating and loading the reader and file handlers ( ~7s of 11s)
- Creating the DataArray from the information in the files/file handlers (~4 of 11s)
So this is purely the slowness of Satpy and the FCI reader dealing with a lot of files.
Possible solutions:
- Make the NetCDF and FCI file handlers faster: a. More, better, faster caching b. Smarter loading of data (only loading coordinates or metadata for first segments but not later segments
- Reimplement the Satpy readers to use dask delayed objects to read/create the file handlers in parallel and/or create the DataArrays in parallel.
I started playing with possible solution 2, by yielding delayed file handlers in
https://github.com/pytroll/satpy/blob/main/satpy/readers/yaml_reader.py#L509
and then computing them in
https://github.com/pytroll/satpy/blob/main/satpy/readers/yaml_reader.py#L599
when passing to file handle filtering. Without computing, the filtering won't work due to delayed objects being immutable.
The processing time stayed the same, but at least some parallel stuff is happening early on. These purple(?) blocks are calls to FCIL1cNCFileHandler. I guess the "flat" bit in between is where the DataArray creation is happening.
My test script is processing 19 day/night composites with resampling to make the task a bit more demanding.
Refactoring
https://github.com/pytroll/satpy/blob/main/satpy/readers/yaml_reader.py#L694-L701
and using dask.delayed, computing the slices and then collecting the usable slices seemed to be doing nothing for the task graph nor performance. I think I'm way of my depth here, but I'll play with this a bit more.