satpy
 satpy copied to clipboard
What's the best parameter of EWA for AVHRR?
This is a difficult question when it comes to AVHRR. The EWA algorithm is dependent on instruments that are scan-based (ex. 10 rows of data per scan of the instrument). It was developed for the MODIS instrument but works well for VIIRS as well. AVHRR is not scan-based but has been shown to get decent results with EWA if you set rows_per_scan to the same number of rows as the whole swath. Some of the EWA algorithms allow you to set it to 0 and it will do this "number of rows" logical for you, but I don't remember what Satpy is using right now. Otherwise, data.shape[0] is good enough.
The rows_per_scan parameter isn't really a "knob" that you can tweak in this algorithm. It is meant to be set to whatever the actual property is for the data.
Hope that helps. Let me know if you have any other questions on this.
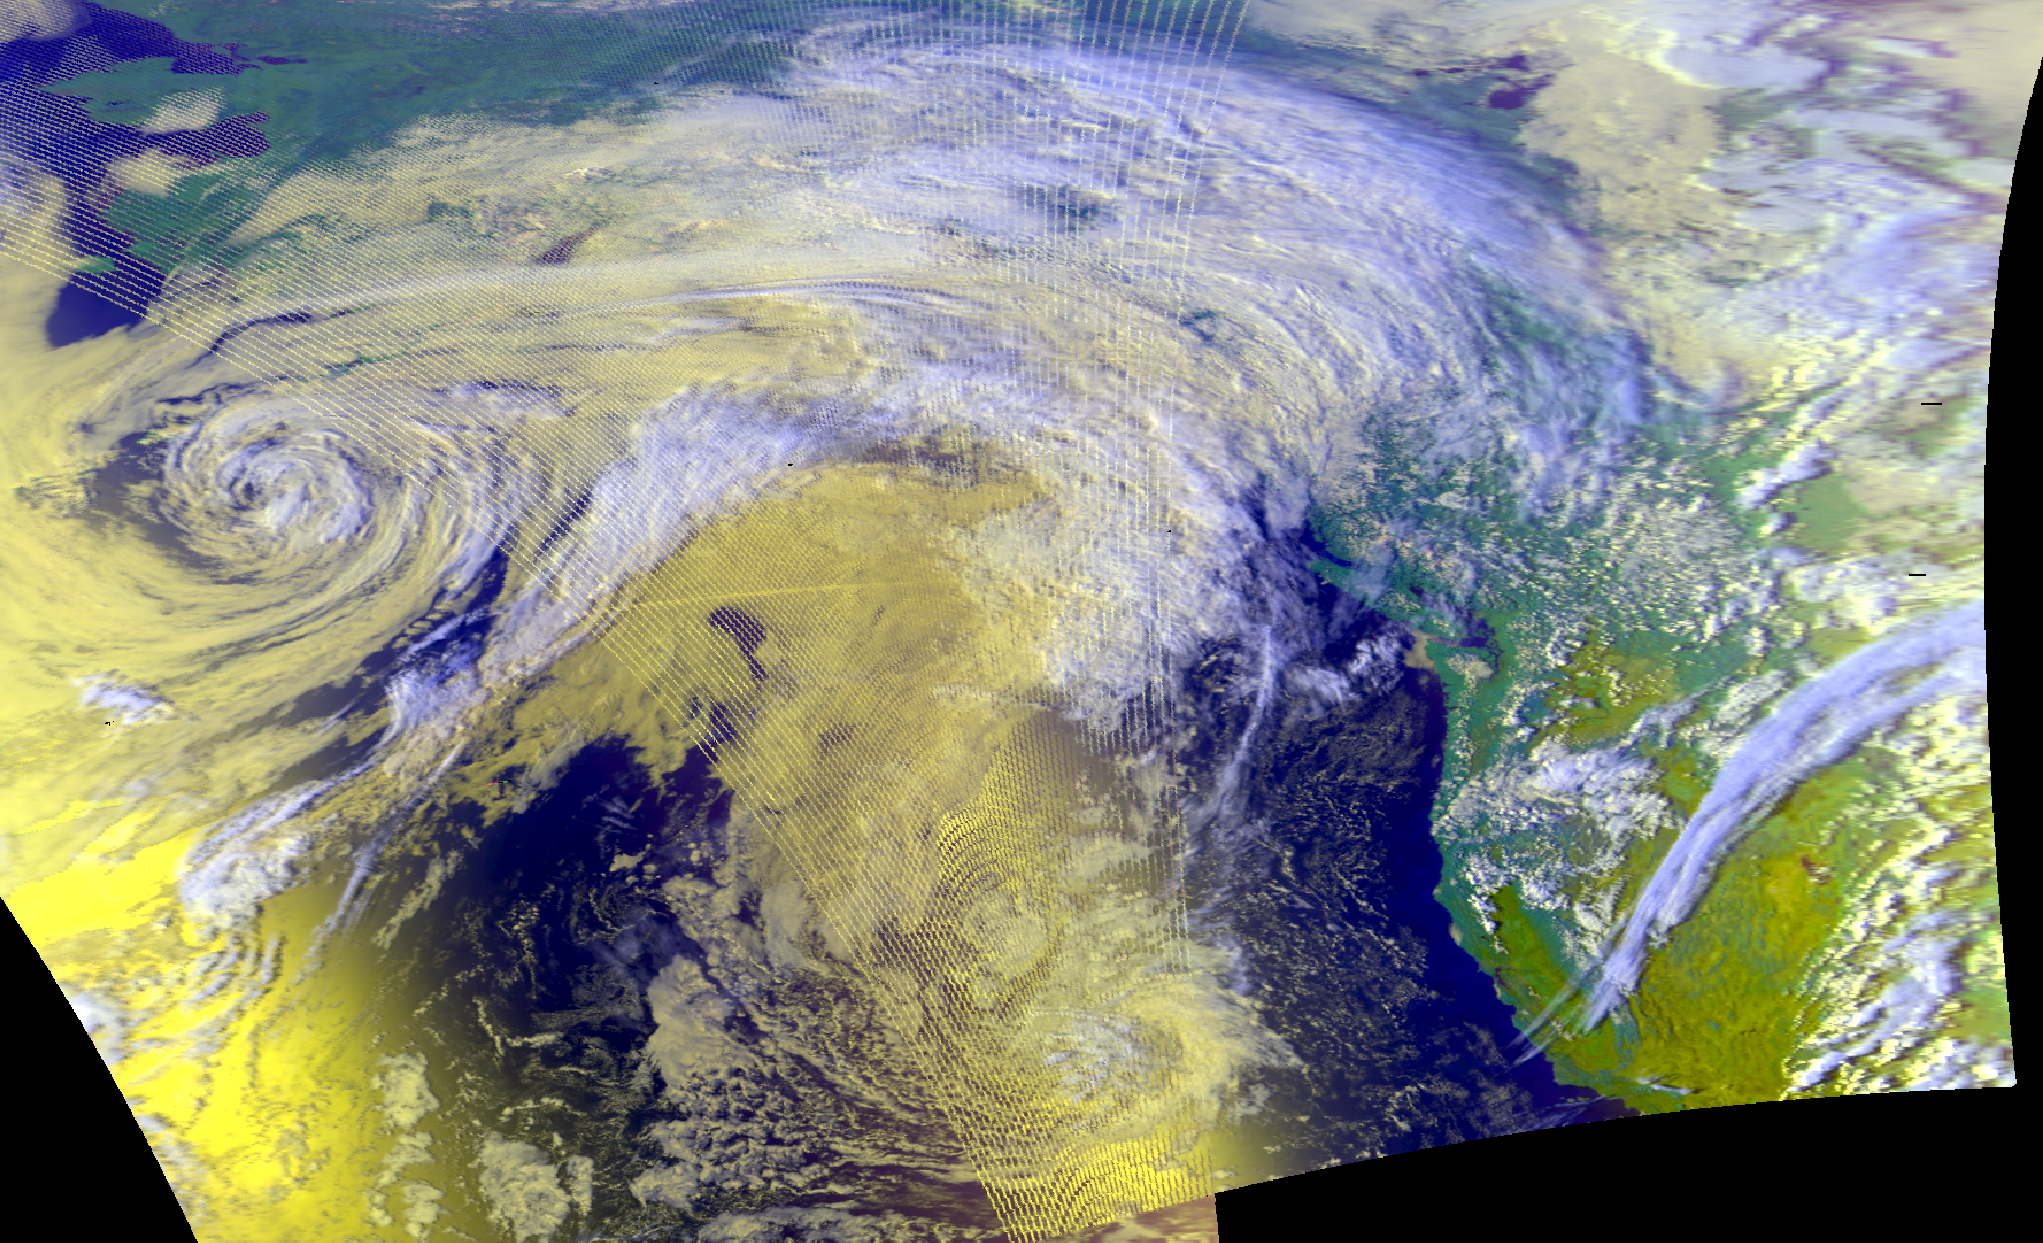
Here's a NOAA-11 swath and its bilinear result.
<xarray.DataArray 'where-239fda9a6efd6729fe2901ac074e0bc5' (bands: 3, y: 11852, x: 409)>
dask.array<where, shape=(3, 11852, 409), dtype=float64, chunksize=(1, 2563, 409), chunktype=numpy.ndarray>
Coordinates:
    crs      object +proj=latlong +datum=WGS84 +ellps=WGS84 +type=crs
  * bands    (bands) <U1 'R' 'G' 'B'
Dimensions without coordinates: y, x
Attributes: (12/25)
    sun_earth_distance_correction_factor:  1.0117714529435458
    start_time:                            1994-09-12 02:40:26.987000
    end_time:                              1994-09-12 04:19:22.487000
    reader:                                avhrr_l1b_gaclac
    midnight_scanline:                     None
    coordinates:                           ('longitude', 'latitude')
    ...                                    ...
    name:                                  overview
    _satpy_id:                             DataID(name='overview', resolution...
    standard_name:                         overview
    prerequisites:                         [DataQuery(wavelength=0.6, modifie...
    optional_prerequisites:                []
    mode:                                  RGB
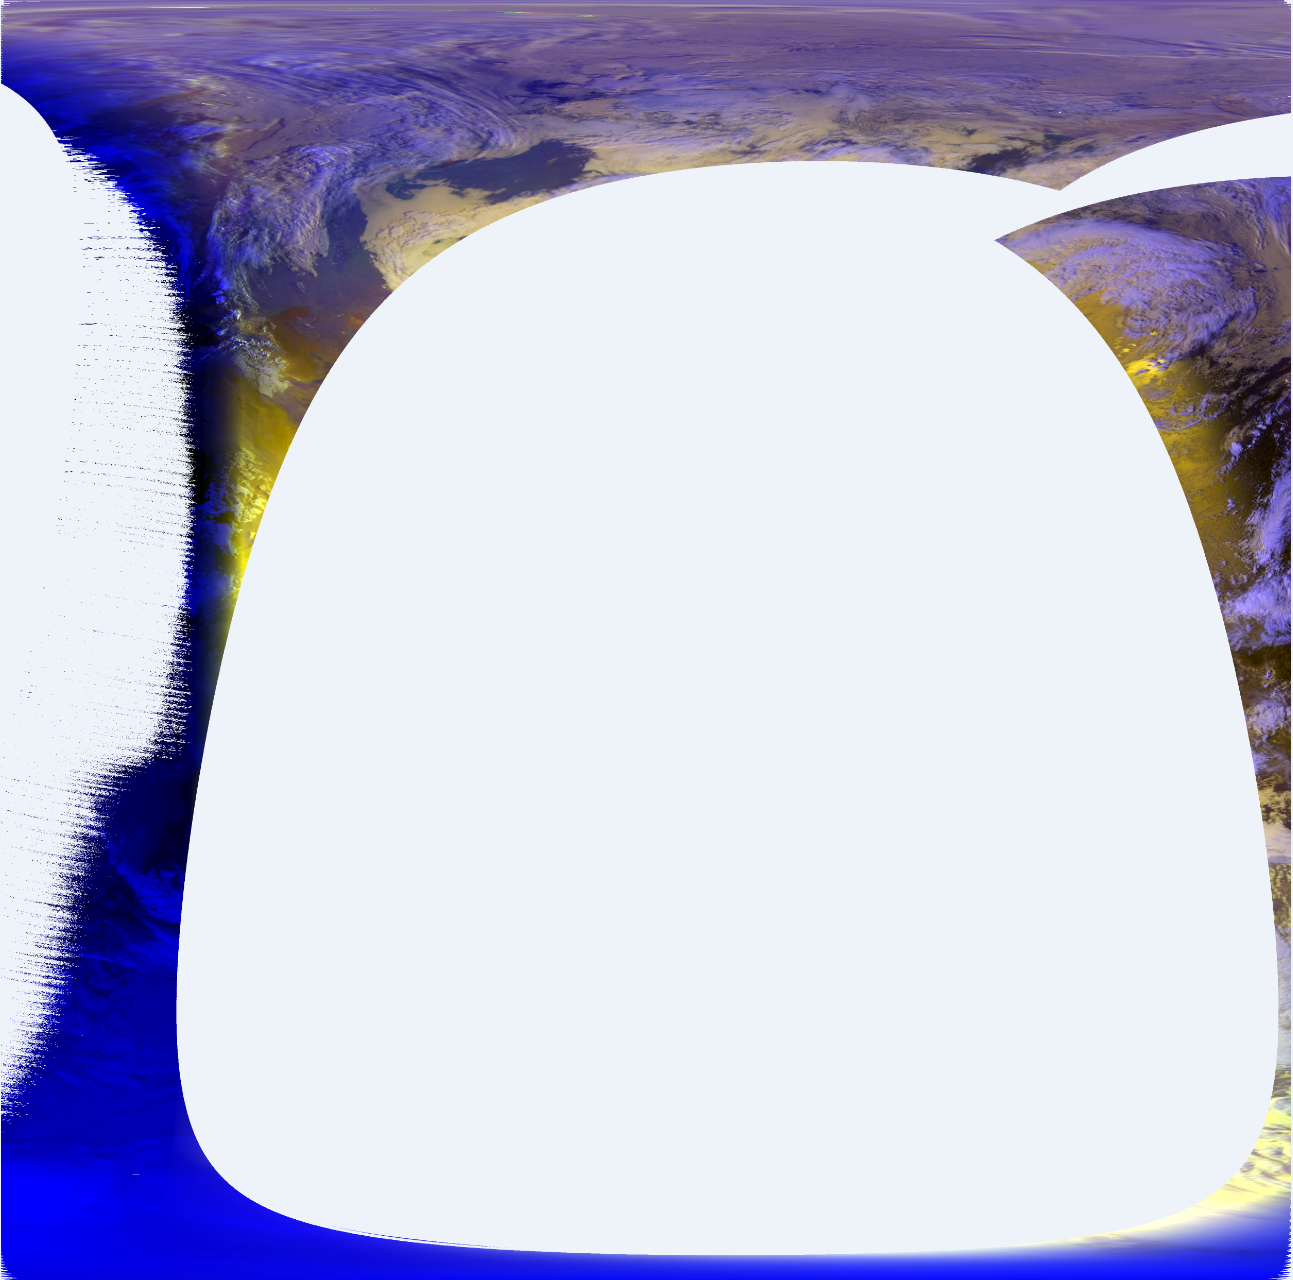
However, when I turned to ewa and set the row_per_scan to 11852 or 0, I got nearly nothing.
 I tried other factors such as 2, 2963, 5926. But none of thoses results are comparable to
 bilinear.
It seems you have multiple orbits of data. Can you try providing only one orbit? Or rather, a smaller geographic region.
I believe the algorithm is getting confused by trying to put data that is geographically "next" to other parts in one output image.
I have resized the area to a more specific one but still can't get the satisfying image. Well I guess I'll just use bilinear.
This looks like you limited the output area. Are you still providing the same amount of input data? The input data is the problem. There may be other things going on here, but the input data is the first thing we should try modifying.
So finally I decided to combine satpy with gdalwarp. Read the Lon/Lat output composites as GCPs and pass them to gdalwarp. With the help of thin plate spline and lanczos, I think the result looks better than bilinear in pyresample, especially the overlapped area.
TPS with Lanczos:
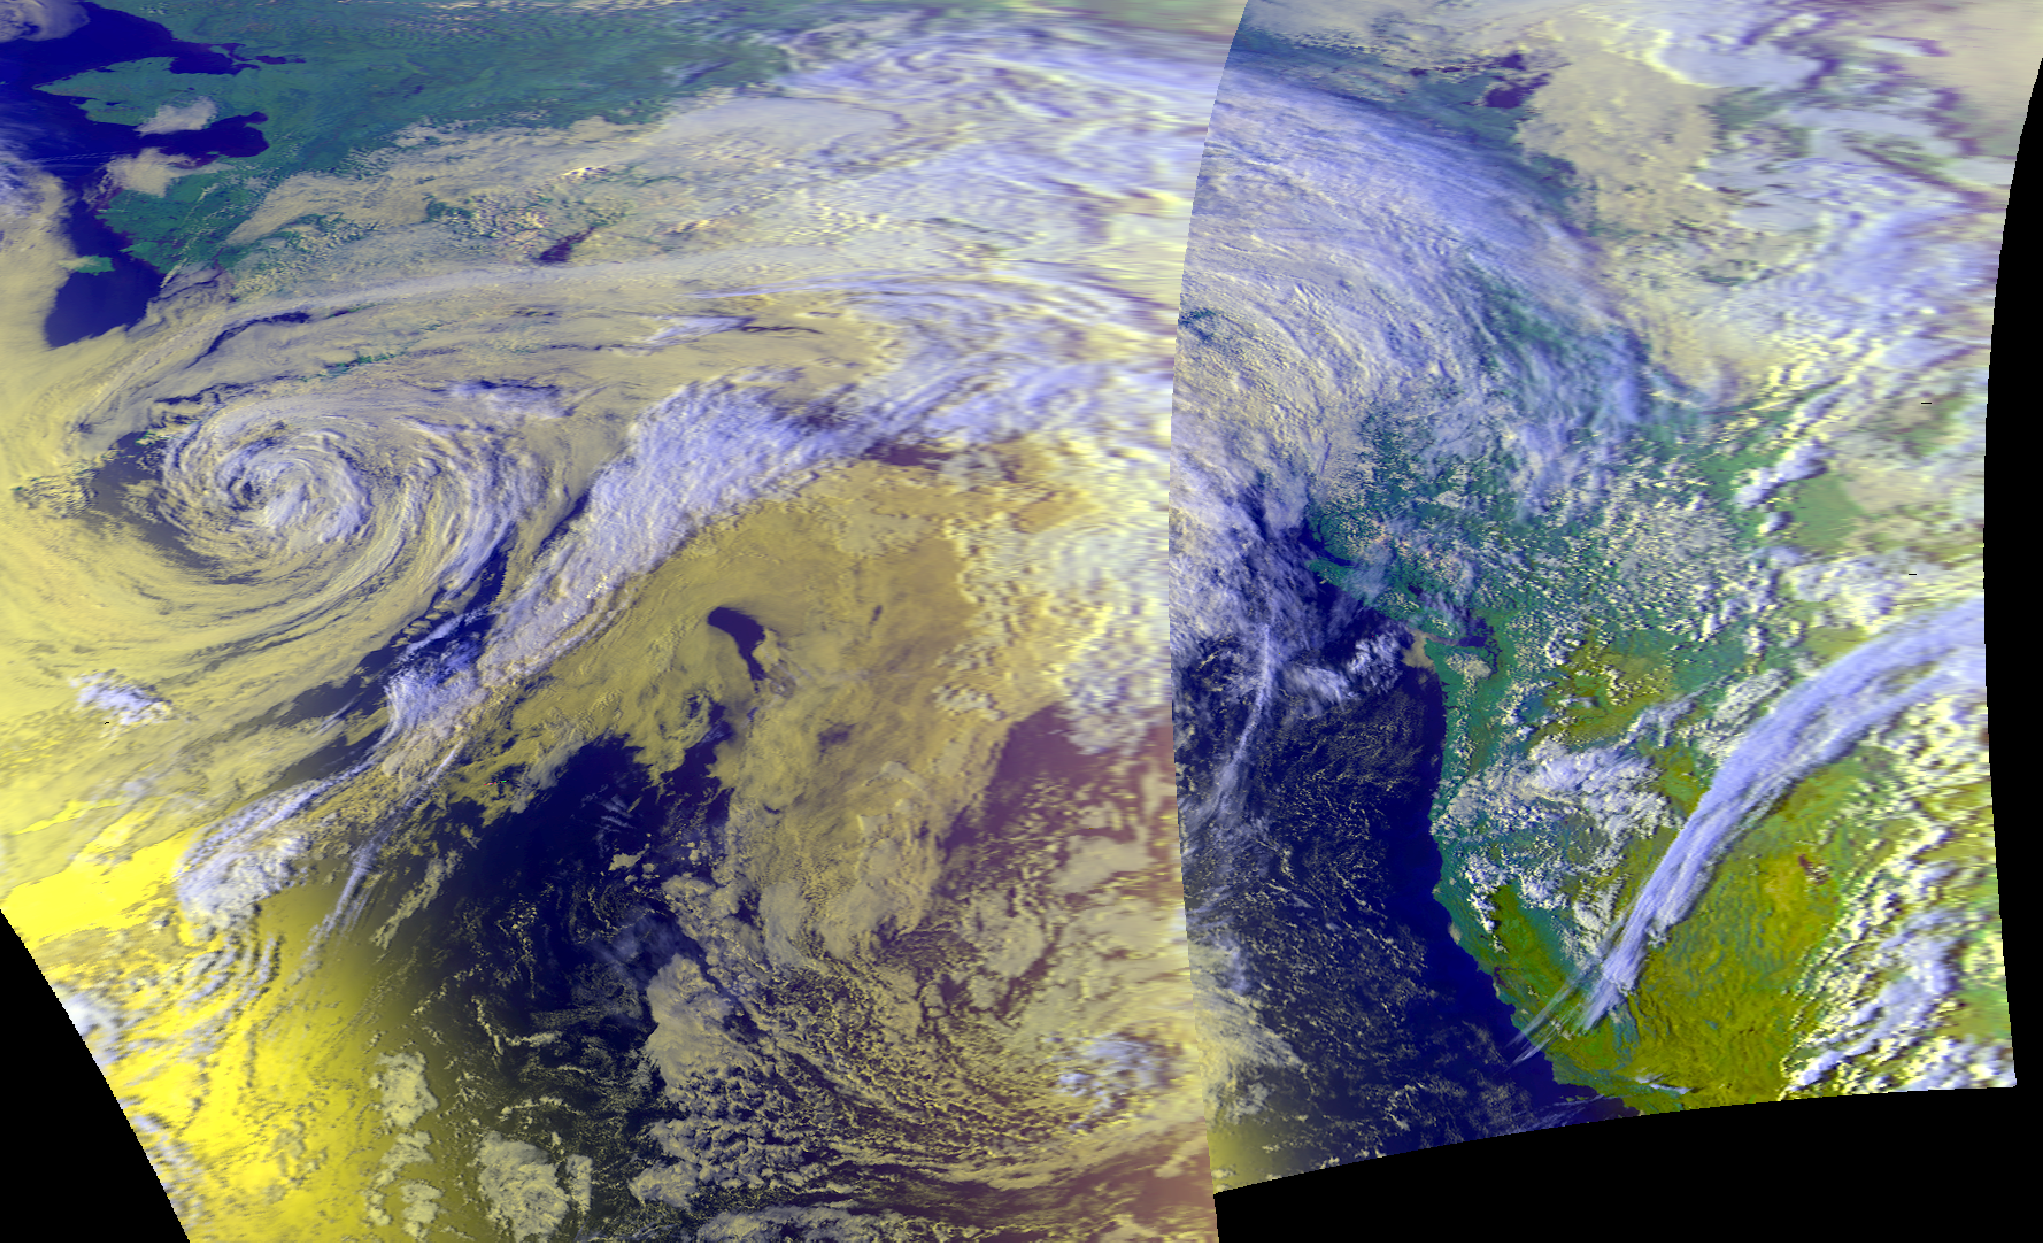
Bilinear:
I'm not exactly sure how you provided your data, but I want to make it clear for anyone who stumbles upon this in the future: the resampling algorithms in Satpy/pyresample are not meant to handle multiple times of data. You can't really get a good looking picture if you process more than one time step of data and say "give me the nearest pixel to this location" when the nearest pixels are at multiple points in time.
My suggestion is to load and resample each time step (or each orbit in the case of AVHRR) separately and then overlay them on top of each other.
But this is a complete swath data from NOAA CLASS. I ordered it without any selection. It has two orbits initially. I don't know how to separate them. Any kwargs I can add while reading the data?
I've never ordered AVHRR data from CLASS so not sure if there is an option there. If CLASS only gave you one single file then maybe this isn't possible. @mraspaud @pnuu @simonrp84 any ideas?
It doesn't seem like anyone else uses CLASS to get AVHRR data from the satpy maintainers. I looked myself and I don't see any related option for the GAC files I was attempting to download. I'm not sure what the best option is.
@sfinkens @ninahakansson and myself have some experience with the GAC data from CLASS, but I don't think we ever used EWA to resample it though
Although the issue was originally about EWA, I think nearest would still be a problem, just less noticeable. The problem is that multiple orbits of data are being interpreted by the resampler as points at the same time. So the end result might have one pixel from orbit 1, but the pixel right next to it from orbit 2.
I talked about this with a colleague: The AVHRR data on CLASS only contains single orbits, there should never be multiple orbits in the same file. Just ordered a few random files myself, and that's definitely how they look to me: Single orbits, only overlap is - as expected - near the poles.
https://drive.google.com/file/d/1t_BBPbaAMoRRvFIJA8RiZUR8u-kYXSqx/view?usp=sharing
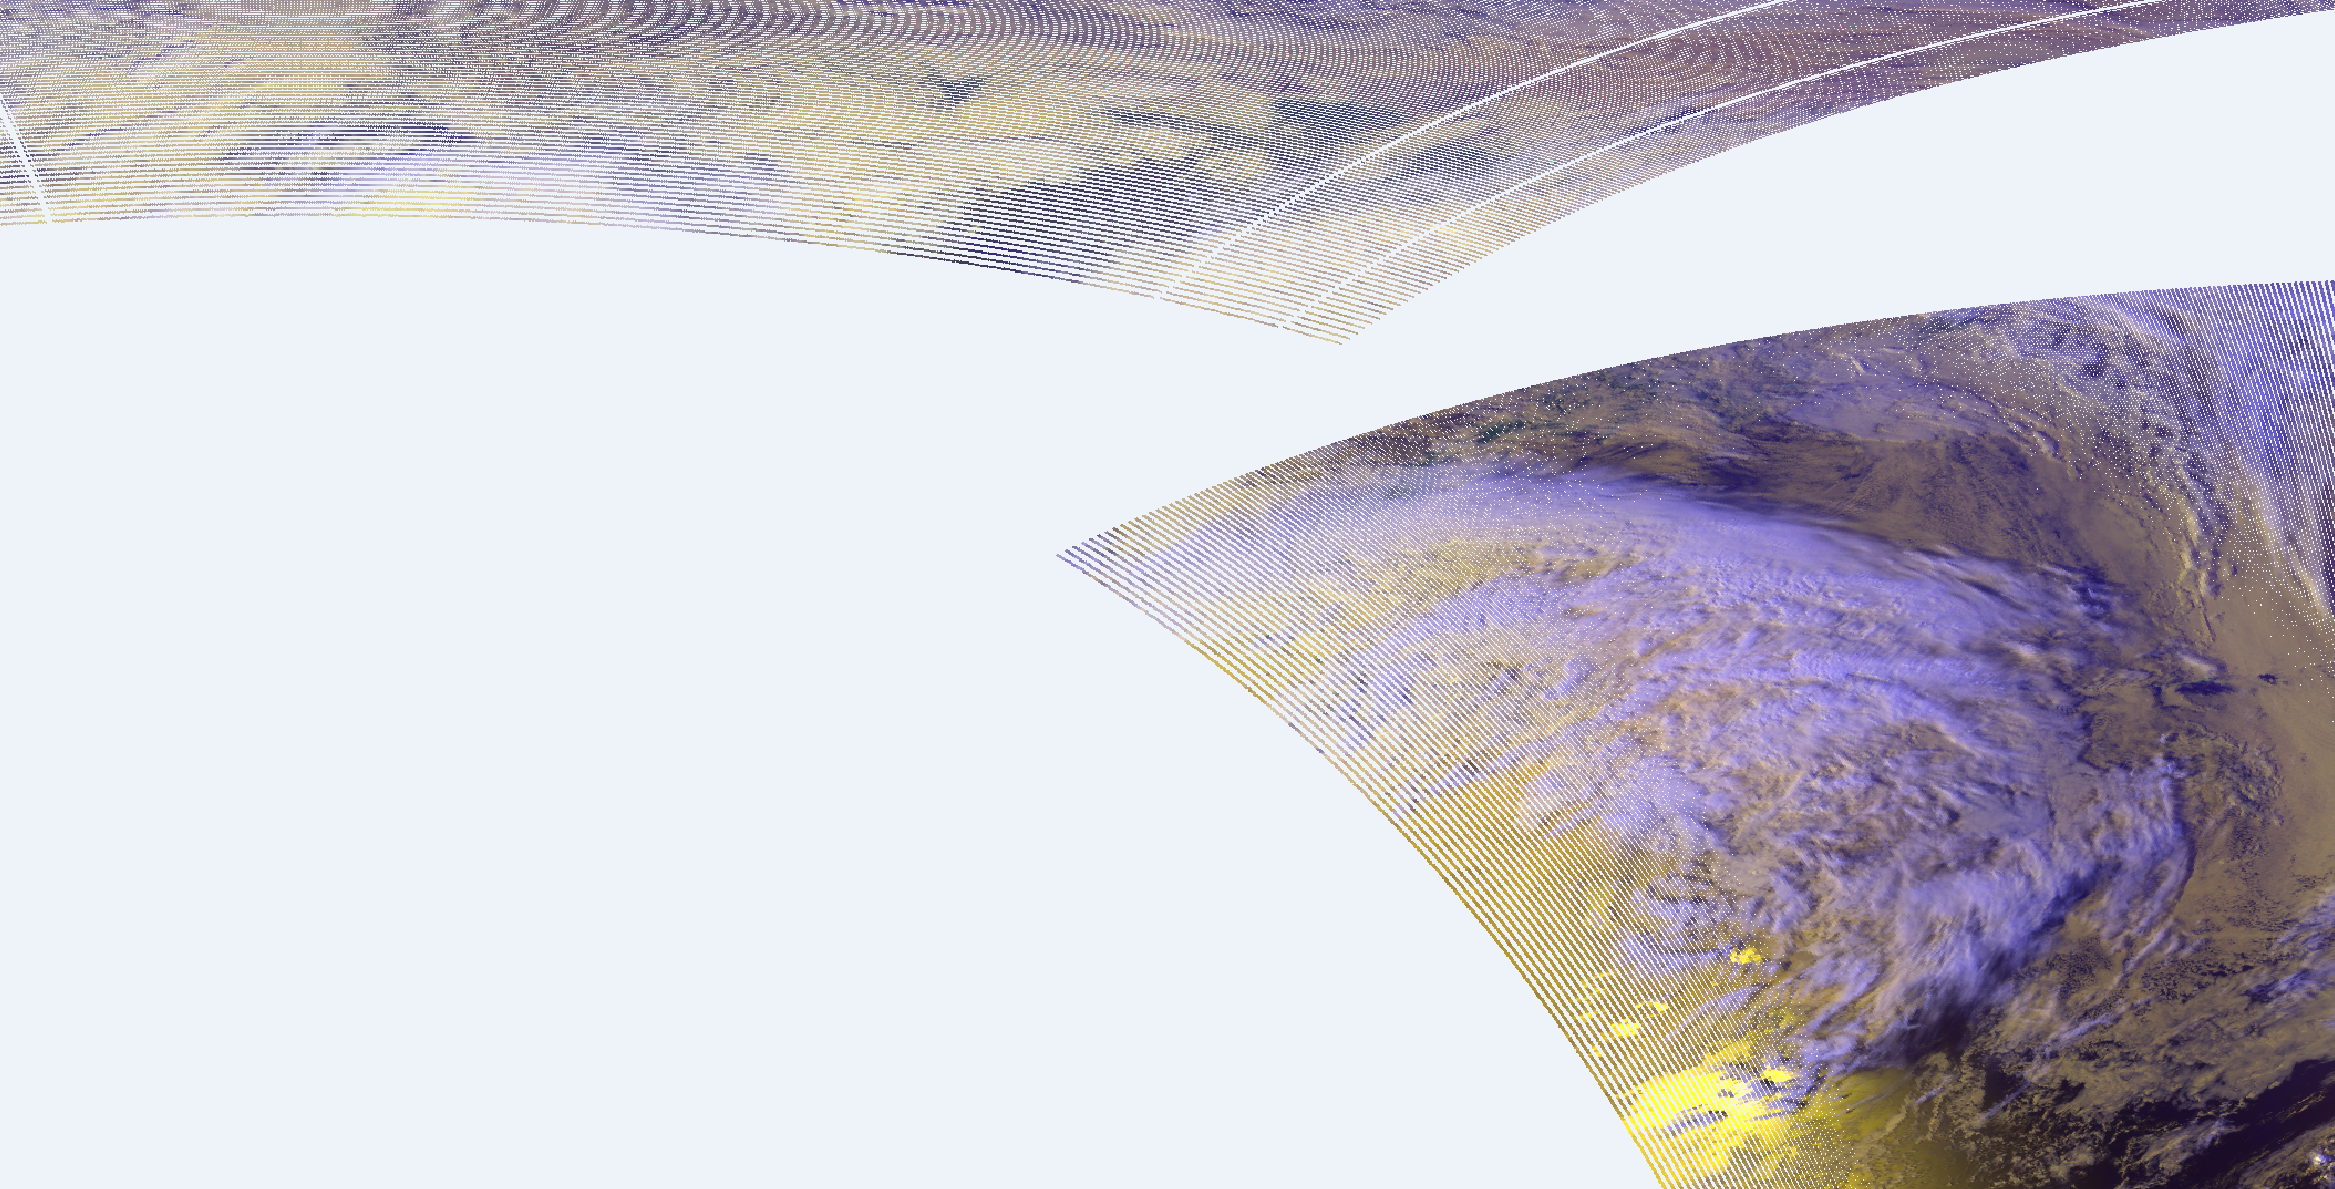
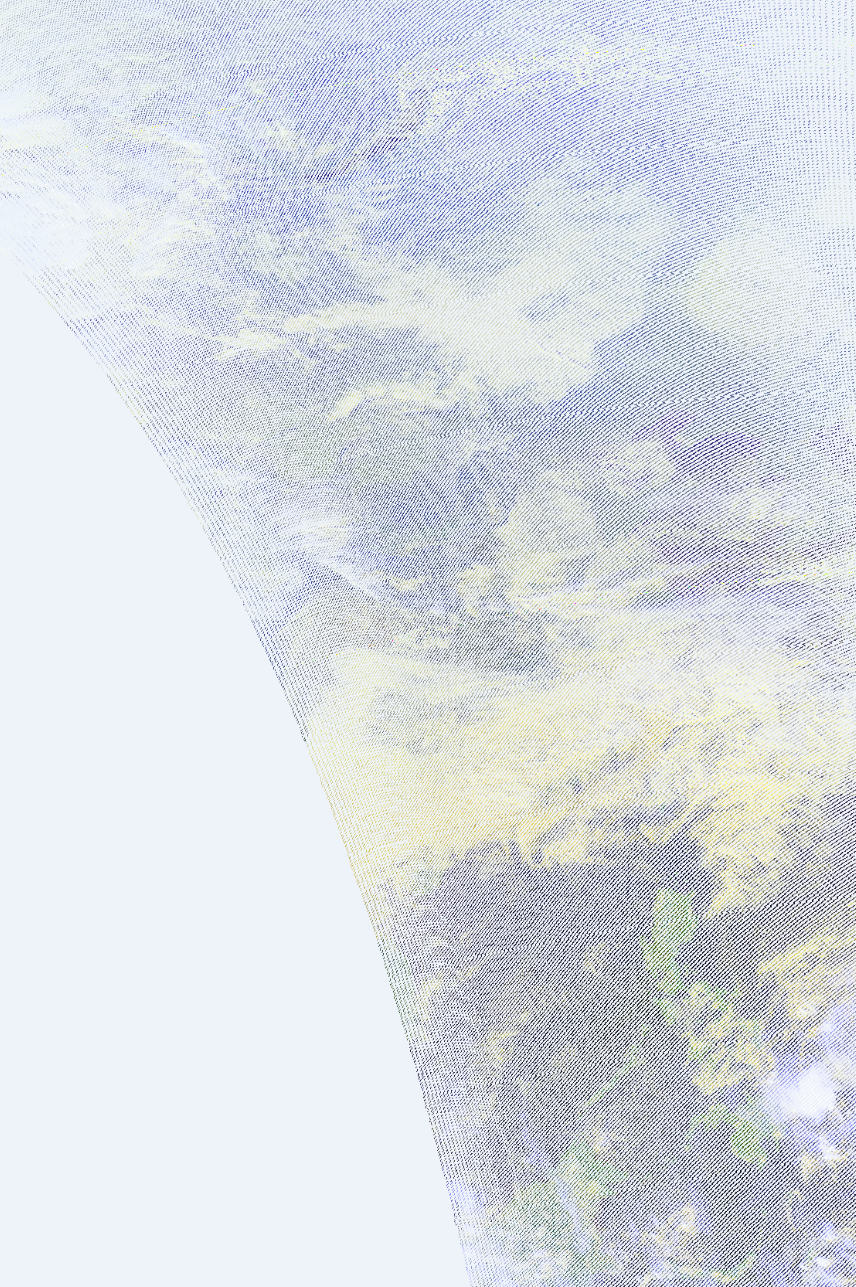
So this is the GAC dataset mentioned above. It actually has some overlap areas (or a second orbit) that looks like this:
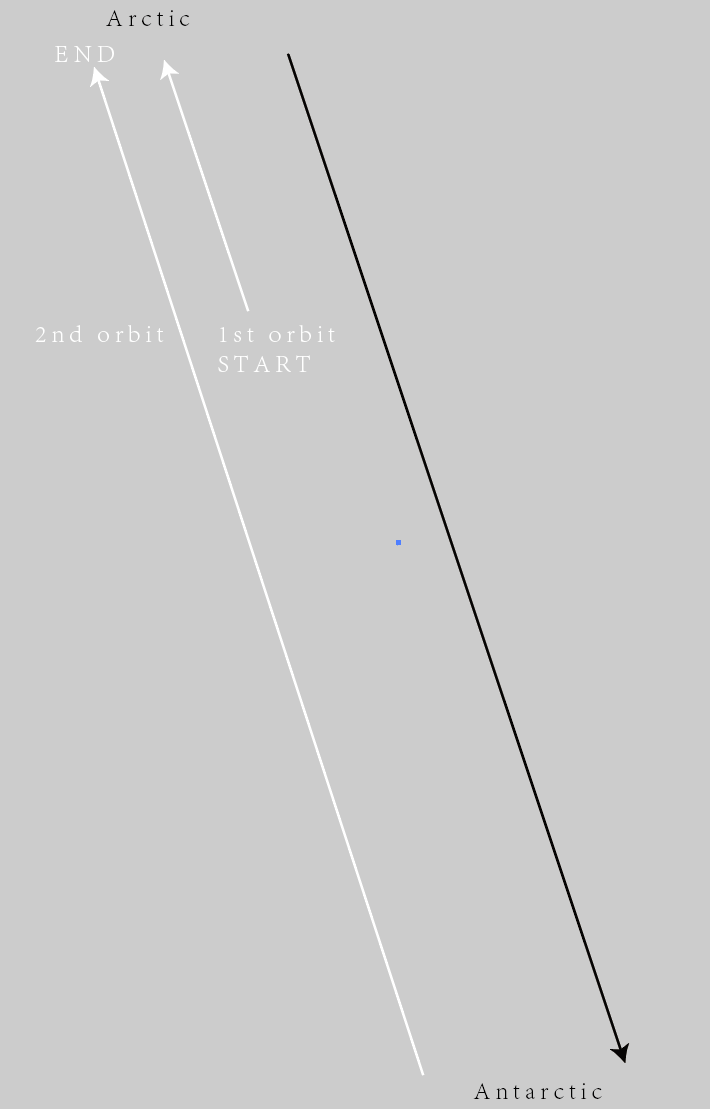
In your second post in this issue you show a full AVHRR orbit that contains no overlap, so this is a bit concerning. Could you please post your code?