MPS device appears much slower than CPU on M1 Mac Pro
🐛 Describe the bug
Using MPS for BERT inference appears to produce about a 2x slowdown compared to the CPU. Here is code to reproduce the issue:
# MPS Version
from transformers import AutoTokenizer, BertForSequenceClassification
import timeit
import torch

tokenizer = AutoTokenizer.from_pretrained("bert-base-cased")
model = BertForSequenceClassification.from_pretrained("bert-base-cased").to(torch.device("mps"))

tokens = tokenizer.tokenize("Hello world, this is michael!")
tids = tokenizer.convert_tokens_to_ids(tokens)
with torch.no_grad():
    t_tids = torch.tensor([tids]*64, device=torch.device("mps"))
    res = timeit.timeit(lambda: model(input_ids=t_tids), number=100)
print(res)
torch.backends.mps.is_available() reports True as expected.
I chose a batch size of 64, since that was mentioned on the blog post for the ~5x speedup in Huggingface BERT.
Running this benchmark, swapping "mps" and "cpu" for the devices, I get: CPU 18.38 s MPS 36.00 s
And, for comparison, running this same snippet on an A10G using CUDA 11.6 on an AWS g5.xlarge instance (ubuntu 20.04, pytorch 1.11.0 compiled from source), I get: CUDA 0.82 s
I used the no_grad() construction due to the comment mentioned on #77753.
I used today's nightly build. Furthermore, I also built PyTorch from source and observed no differences on the results here. Lastly, I confirmed with Activity Monitor and powermetrics that the GPU is in fact being used, seeing GPU usage at 98.8%, GPU power spike to 15711 mW when running the MPS benchmark, and CPU power spiking as expected when running the CPU benchmark.
So it does seem like things are "hooked up" right, just not efficient.
As a side note, when building PyTorch from source, I observed in the CMake logs that Accelerate.framework was selected as the BLAS library, but sadly I didn't observe any power consumption by the ANE module, which is too bad.
Thanks for all the hard work on this new feature, and looking forward to any insights and further improvements!
Versions
PyTorch version: 1.12.0.dev20220518
Is debug build: False
CUDA used to build PyTorch: None
ROCM used to build PyTorch: N/A

OS: macOS 12.3 (arm64)
GCC version: Could not collect
Clang version: 13.1.6 (clang-1316.0.21.2.3)
CMake version: version 3.23.1
Libc version: N/A

Python version: 3.9.12 (main, Mar 26 2022, 15:44:31)  [Clang 13.1.6 (clang-1316.0.21.2)] (64-bit runtime)
Python platform: macOS-12.3-arm64-arm-64bit
Is CUDA available: False
CUDA runtime version: No CUDA
GPU models and configuration: No CUDA
Nvidia driver version: No CUDA
cuDNN version: No CUDA
HIP runtime version: N/A
MIOpen runtime version: N/A
Is XNNPACK available: True

Versions of relevant libraries:
[pip3] mypy==0.942
[pip3] mypy-extensions==0.4.3
[pip3] numpy==1.22.3
[pip3] torch==1.12.0.dev20220518
[pip3] torchaudio==0.11.0
[pip3] torchvision==0.12.0
[conda] Could not collect
I'd also add that I saw the same effects when running timeit with the toy examples in docs/source/notes/mps.rst. (e.g.: timeit.timeit(lambda: x * 2, number=100000) on both mps/GPU.
Example of the toy example run:
In [17]: # toy example mps
    ...: import timeit
    ...: import torch
    ...: import random
    ...:
    ...: x = torch.ones(5000, device="mps")
    ...: timeit.timeit(lambda: x * random.randint(0,100), number=100000)
Out[17]: 4.568202124999971

In [18]: # toy example cpu
    ...: import timeit
    ...: import torch
    ...: import random
    ...:
    ...: x = torch.ones(5000, device="cpu")
    ...: timeit.timeit(lambda: x * random.randint(0,100), number=100000)
Out[18]: 0.30446054200001527
but sadly I didn't observe any power consumption by the ANE module, which is too bad.
The neural engine can't be used for training anyway. It only supports Float16, Int8, and UInt8, and is only accessible through CoreML and MLCompute. PyTorch uses neither of these APIs for training.
Could you check in the activity monitor whether it's using multiple CPU cores? If so, it would just be utilizing the AMX to maximum capacity, reaching multiple TFLOPS of compute power on the CPU. Thus, certain models would close the gap in performance between CPU and GPU, making CPU faster.
The neural engine can't be used for training anyway. It only supports Float16, Int8, and UInt8, and is only accessible through CoreML and MLCompute. PyTorch uses neither of these APIs for training.
Very interesting, thanks for the context, I'm among many who are curious about the ANE. I wonder if it could be useful for quantized models, though I suppose this is what Core ML Tools is for.
I have checked the activity monitor with the toy multiplication example above and increasing the number of steps to 1e7. I observed:
- Running on the CPU device, the toy example completes in 23s, only saturating one core (CPU usage does not exceed 100)
- Running on the MPS device, GPU is saturated at 100%, and CPU usage of the python process reaches 175%. Memory usage of the python process increases without end, similar to what was described in #77753. kernel_task CPU usage around 35-40%, which was not observed on the CPU device. Benchmark takes 441s.
From https://github.com/pytorch/pytorch/issues/77753#issuecomment-1132230314, the GPU may be slower because it spends more of its time writing to new memory than actually executing. Also, since it continues writing to new memory on every iteration, that might destroy cache coherence which brings down performance further.
Although if each tensor is deallocated and reallocated on every loop iteration, then this bottleneck would appear regardless of whether there was a memory leak. Metal forces the memory to be overwritten with zeros when you initialize a MTLBuffer - something you can sometimes avoid in CUDA.
Fascinating. That hypothesis might also explain why the delta is so much worse with the toy example compared to the full size BERT.
I do have a workaround planned for my own framework (s4tf/s4tf) where I will bypass this restriction. It's described in https://github.com/AnarchoSystems/DeepSwift/issues/1#issuecomment-1129891796, although please don't comment on that thread. @albanD does your backend use MTLHeap's in the way I described to permit zero-cost memory allocation?
Note: This is still just a theoretical idea. I don't have a proof-of-concept of that in action, but it shouldn't be hard to set up.
As of pytorch-nightly build 1.13.0.dev20220522
- CPU
18.835263124999983s - MPS
18.363079624999955s
I have another example where mps is roughly 7x slower than cpu, doing nothing but matrix multiplications. I'm on nightly build 1.13.0.dev20220627:
a_cpu = torch.rand(1000, device='cpu')
b_cpu = torch.rand((1000, 1000), device='cpu')
a_mps = torch.rand(1000, device='mps')
b_mps = torch.rand((1000, 1000), device='mps')

print('cpu', timeit.timeit(lambda: a_cpu @ b_cpu, number=100_000))
print('mps', timeit.timeit(lambda: a_mps @ b_mps, number=100_000))
Prints:
cpu 3.126431
mps 23.259843875
Interestingly, if I do the same experiment as above using smaller tensors, the disparity grows to mps being roughly 25x slower:
a_cpu = torch.rand(250, device='cpu')
b_cpu = torch.rand((250, 250), device='cpu')
a_mps = torch.rand(250, device='mps')
b_mps = torch.rand((250, 250), device='mps')

print('cpu', timeit.timeit(lambda: a_cpu @ b_cpu, number=100_000))
print('mps', timeit.timeit(lambda: a_mps @ b_mps, number=100_000))
Prints:
cpu 0.8596386669999999
mps 19.975668917
I have observed the same problem, on an AMD GPU, got a 3x slow down compare to CPU. Any fixes available yet?
I wonder if we could convert this to actual MPS code in Swift, then profile how long that code takes. That would determine whether the bottleneck is PyTorch’s fault and something that can be fixed.
From a distance, it looks like a fundamental problem of GPU communication overhead. Is your timing mechanism taking the number of seconds for one iteration, then multiplying it by 100,000?
another datapoint here: (nightly build 1.13.0.dev20220704, i7-7920HQ / Radeon Pro 560)
running the two matrix multiplication tasks above
cpu 4.141497317003086
mps 102.30748211298487
cpu 0.7337763879913837
mps 55.41895890497835
@kulinseth @albanD I noticed this ticket's been subject to triage, and a few other folks have filed issues regarding similar observations.
Do you know how the figure in the press release (about large MPS performance benefits) was computed?
This might be why it’s so slow. Worth reading if you have the time.
https://discuss.pytorch.org/t/sequential-throughput-of-gpu-execution/156303
@kulinseth @albanD I noticed this ticket's been subject to triage, and a few other folks have filed issues regarding similar observations.
Do you know how the figure in the press release (about large MPS performance benefits) was computed?
Hi @mmisiewicz , those numbers were collected on a M1 Ultra system using torchbench with the Batch size as listed in the figure. The command used was:
pytest test_bench.py -k "resnet50 or hf_Bert or vgg16" --ignore_machine_config
and compare the MPS time with CPU time.
Testing conducted by Apple in April 2022 using production Mac Studio systems with Apple M1 Ultra, 20-core CPU, 64-core GPU 128GB of RAM, and 2TB SSD. Tested with macOS Monterey 12.3, prerelease PyTorch 1.12, ResNet50 (batch size=128), HuggingFace BERT (batch size=64), and VGG16 (batch size=64). Performance tests are conducted using specific computer systems and reflect the approximate performance of Mac Studio.
@philipturner Thanks for the great read.
@kulinseth thanks for sharing, I'll try running that on my system, and I'm curious to dig in, because when I ran my own benchmarks with HuggingFace's BERT on an MPS device on an M1 Pro it was dramatically slower, so maybe I can dig through the benchmark scripts and see if I've got something wrong.
And my M1 Studio is on order 😄
@mmisiewicz can you try with latest nightly how the performance looks like? Also are you running the mentioned network :
# MPS Version
from transformers import AutoTokenizer, BertForSequenceClassification
import timeit
import torch

tokenizer = AutoTokenizer.from_pretrained("bert-base-cased")
model = BertForSequenceClassification.from_pretrained("bert-base-cased").to(torch.device("mps"))

tokens = tokenizer.tokenize("Hello world, this is michael!")
tids = tokenizer.convert_tokens_to_ids(tokens)
with torch.no_grad():
    t_tids = torch.tensor([tids]*64, device=torch.device("mps"))
    res = timeit.timeit(lambda: model(input_ids=t_tids), number=100)
print(res)
to do your measurement.?
Device: M1 Pro 10CPU 16GPU
Training my model using mps:
0m 2s (Time Remaining: 4167m 10s) (epoch: 1 finish: 0%)
0m 5s (Time Remaining: 4838m 36s) (epoch: 2 finish: 0%)
0m 8s (Time Remaining: 4894m 53s) (epoch: 3 finish: 0%)
0m 13s (Time Remaining: 5462m 44s) (epoch: 4 finish: 0%)
Training my model using CPU:
0m 0s (Time Remaining: 945m 23s) (epoch: 1 finish: 0%)
0m 1s (Time Remaining: 879m 47s) (epoch: 2 finish: 0%)
0m 1s (Time Remaining: 933m 46s) (epoch: 3 finish: 0%)
0m 2s (Time Remaining: 1024m 4s) (epoch: 4 finish: 0%)
@realJustinLee , can you please provide a test-case to repro this? Also what torch nightly version you are using for these numbers?
@kulinseth Repo: https://github.com/realJustinLee/dumb-chatbot
torch==1.13.0.dev20220715
torchaudio==0.14.0.dev20220603
torchvision==0.14.0.dev20220715
MPS Version
from transformers import AutoTokenizer, BertForSequenceClassification import timeit import torch
tokenizer = AutoTokenizer.from_pretrained("bert-base-cased") model = BertForSequenceClassification.from_pretrained("bert-base-cased").to(torch.device("mps"))
tokens = tokenizer.tokenize("Hello world, this is michael!") tids = tokenizer.convert_tokens_to_ids(tokens) with torch.no_grad(): t_tids = torch.tensor([tids]*64, device=torch.device("mps")) res = timeit.timeit(lambda: model(input_ids=t_tids), number=100) print(res)
CPU M1 8Core 16G RAM
Using mps : 65.45052295800001
Using cpu : 24.685709957999997
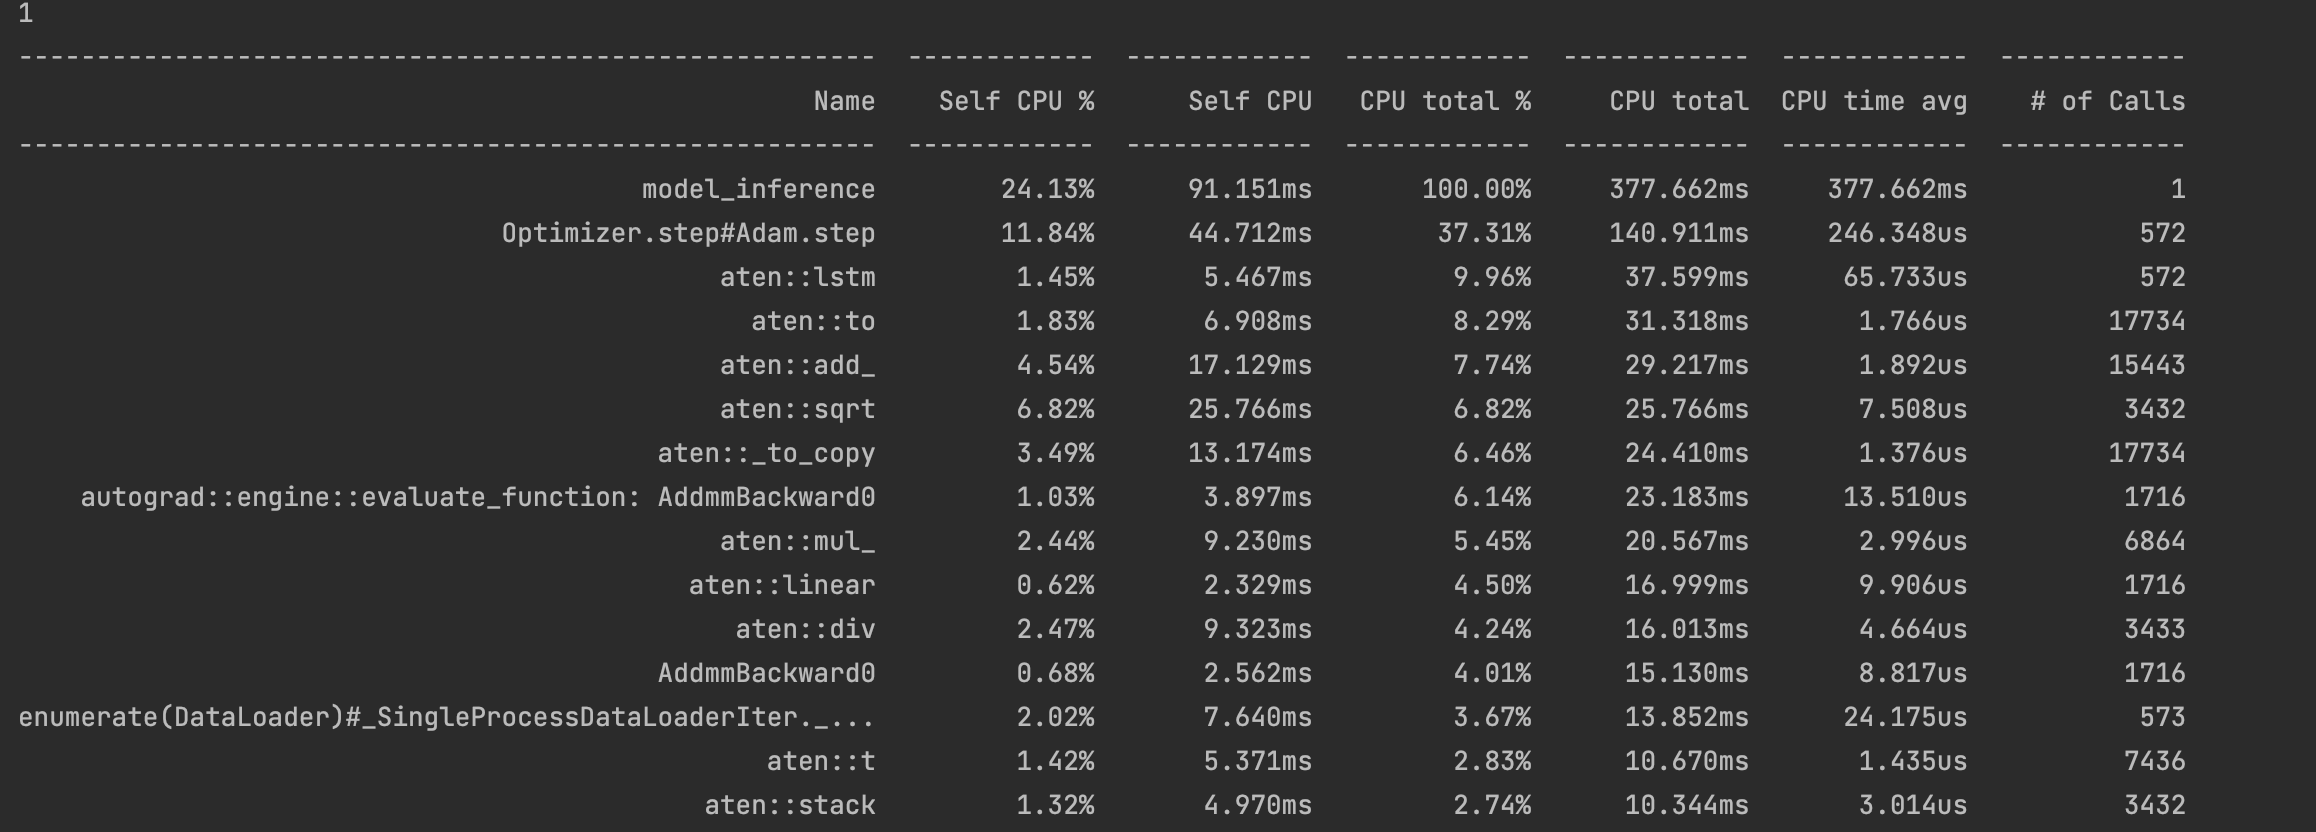
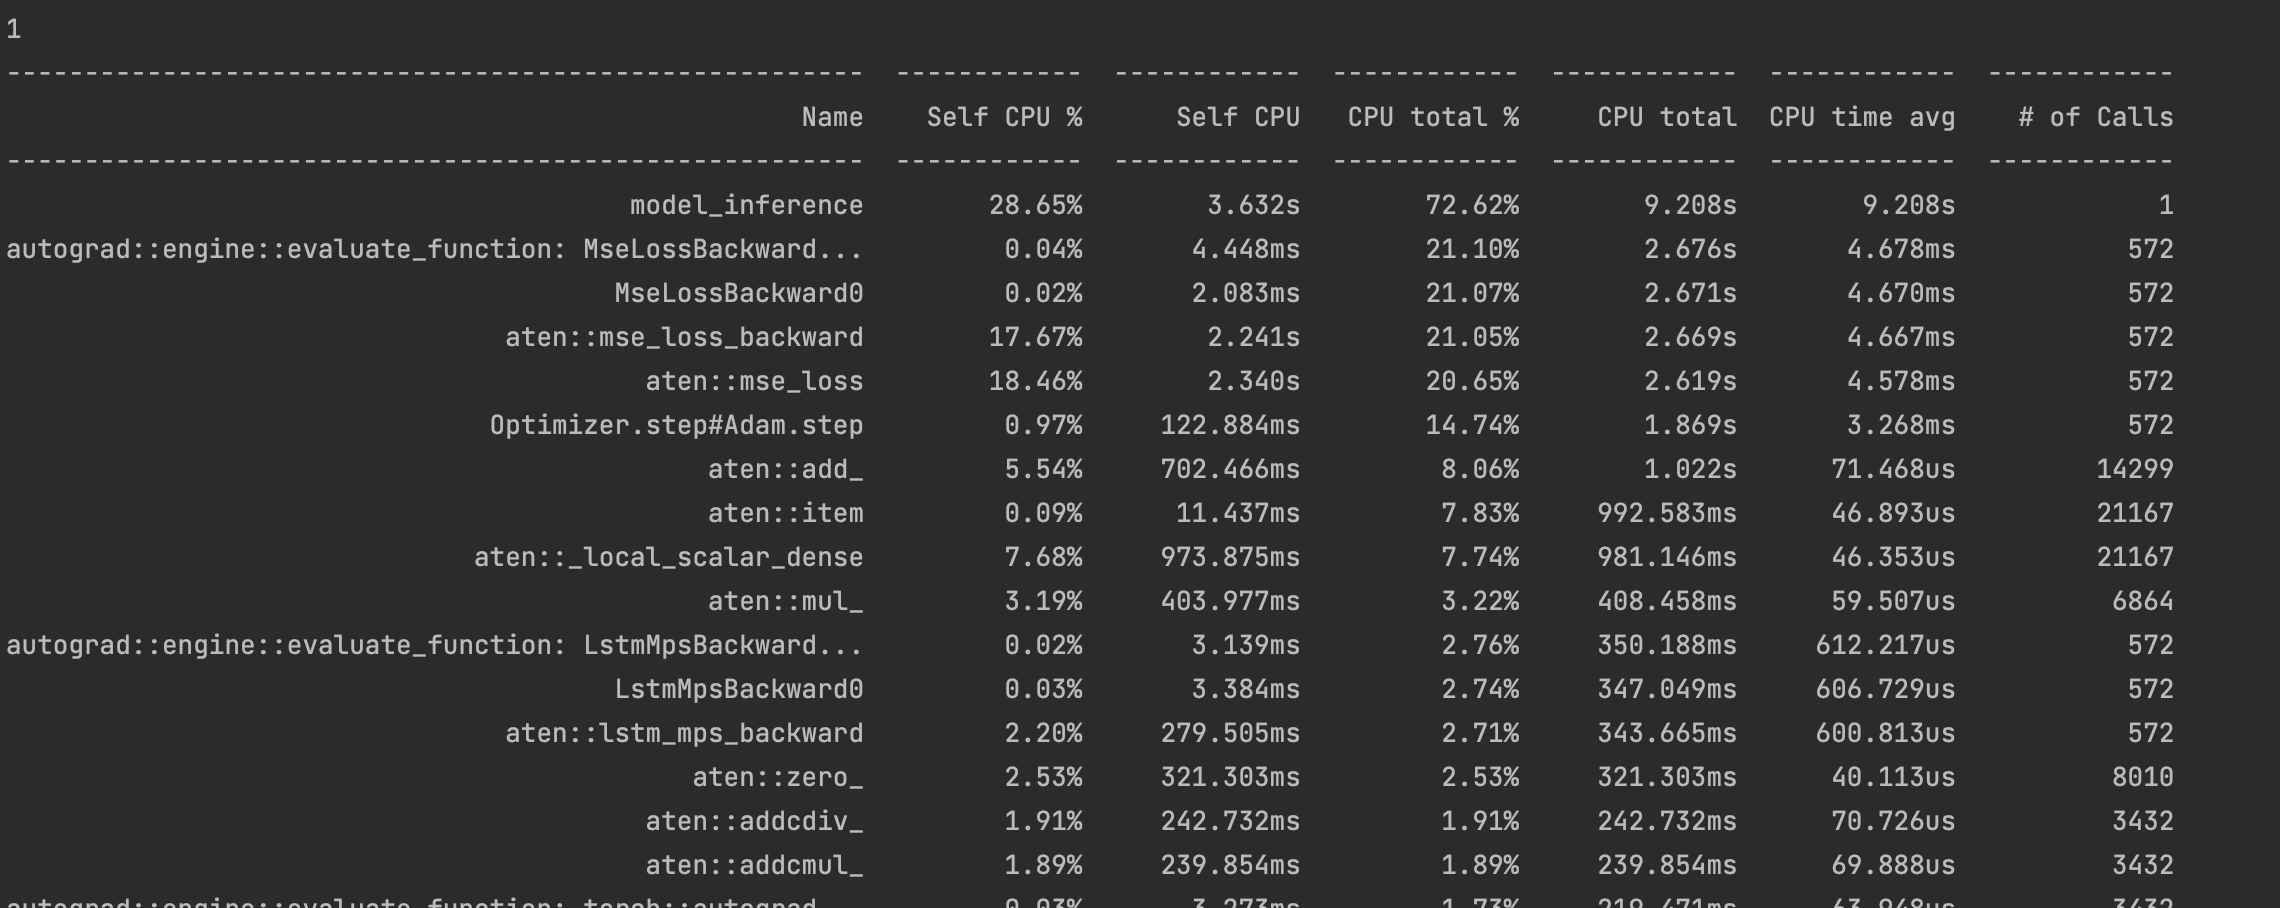
Same here for LSTM examples. I used Torch Profiler to see the performance difference:
CPU:
MPS:
The spike in microsecond-level overhead (CPU time avg) was discussed here. I think I’ve found a solution to it, but haven’t put it into practice with an RNN.
The spike in microsecond-level overhead (CPU time avg) was discussed here. I think I’ve found a solution to it, but haven’t put it into practice with an RNN.
Any recent plan to implement it? Looking forward to it.
Any recent plan to implement it?
I’m not planning to implement it in PyTorch; however, it’s open source and I’ve explained it in great depth. Someone else could look at it and reimplement it in PyTorch. If anyone does, @mention me and I can take a look.
I just wanted to showcase the hard work and months of planning that went into these optimizations of driver overhead in my project. They are showing real-world performance gains that could make it significantly faster than PyTorch (at least with the current MPS backend) for certain use cases.
Current repo: https://github.com/philipturner/metal-experiment-1
Will eventually migrate to: https://github.com/s4tf/metal
Regarding a working RNN implementation, it probably won't happen any time within the next few weeks. I'm juggling a bunch of other projects simultaneously, so things will happen slowly regarding the Metal backend. I need to fix an existing bug in constant folding and support MPSKernel caching for an MPSMatrixMultiplication. Perhaps I also need to support some NDArray ops, which are only exposed with reasonable overhead in MPSGraph.
Device: M1 Pro 8CPU 14GPU
Just to add some more data points, using the nightly build 1.13.0.dev20220818.
Experiment 1 Running the following code:
a_cpu = torch.rand(1000, device='cpu')
b_cpu = torch.rand((1000, 1000), device='cpu')
a_mps = torch.rand(1000, device='mps')
b_mps = torch.rand((1000, 1000), device='mps')

print('cpu', timeit.timeit(lambda: a_cpu @ b_cpu, number=100_000))
print('mps', timeit.timeit(lambda: a_mps @ b_mps, number=100_000))
I get the following results:
cpu 2.9181434169999996
mps 13.219588082999998
Experiment 2 Running the following code:
a_cpu = torch.rand(250, device='cpu')
b_cpu = torch.rand((250, 250), device='cpu')
a_mps = torch.rand(250, device='mps')
b_mps = torch.rand((250, 250), device='mps')

print('cpu', timeit.timeit(lambda: a_cpu @ b_cpu, number=100_000))
print('mps', timeit.timeit(lambda: a_mps @ b_mps, number=100_000))
I get the following results:
cpu 0.7114390410000624
mps 12.975056834000043
That strongly suggests it's a driver overhead bottleneck. The CPU takes 1/4 as long when you go from 1000 to 250. Perhaps it should take 1/16 ((1/4)^2) as long in theory - I haven't double-checked my math. Meanwhile, the GPU takes just as long. An estimate of theoretical GPU speed, if PyTorch has minimal driver overhead:
- CPU decreases from 2.9 to 0.7 which is a 75% decrease.
- GPU decreases by 0.25 which is a 75% decrease if no driver overhead exists.
- If no driver overhead exists, GPU decreases from 0.33 to 0.08.
Theoretical ratio of GPU:CPU execution time: 0.33/2.9 (or 0.08/0.7) = 0.11. The GPU has access to double the bandwidth of single-core CPU, or the same bandwidth as all 8 CPU cores used simultaneously. Meanwhile, the FLOPS ratio is 5.3 trillion / (4 FP32 ops/clock * 3.2 billion Hz * 6 Performance Cores) = 69:1. Do these metrics match the theoretical ratio of GPU:CPU execution time being 0.11?
- If bandwidth limited, GPU takes 50% to 100% the time of CPU.
- If ALU limited, GPU takes 1/69 the time of CPU (~2%).
0.02 < 0.11 < 0.50
Therefore, in absence of driver overhead, it is reasonable to conclude that:
The first result could be:
cpu 2.9181434169999996
mps 0.330588082999998
The second result could be:
cpu 0.7114390410000624
mps 0.080056834000043
Based on my experiments, driver overhead can be reduced significantly from a naive implementation. In the best case, there is a 100x reduction. In the average case, there is a 10x reduction. The driver overhead here was:
Based on top data point, 13.22 - 0.33 = 12.89. Based on bottom data point, 12.98 - 0.08 = 12.90. Stick with 12.9 for simplicity.
In the average (pessimistic) case, driver overhead shrinks from 12.9 to 1.29. The two results become:
cpu 2.9181434169999996
mps 1.620588082999998

cpu 0.7114390410000624
mps 1.370056834000043
In the optimistic case, driver overhead shrinks from 12.9 to 0.13. The two results become:
cpu 2.9181434169999996
mps 0.460588082999998

cpu 0.7114390410000624
mps 0.210056834000043
Since you're running 100,000 operations to profile, you're repeating a lot of homogeneous operations. That is very likely to fall into the optimistic case, skewing the benchmarks to portray lower driver overhead (if PyTorch's MPS backend were to be rewritten).
Yeah thats interesting. Here is my results if it helps.
Experiment 1:
a_cpu = torch.rand(1000, device='cpu')
b_cpu = torch.rand((1000, 1000), device='cpu')
a_mps = torch.rand(1000, device='mps')
b_mps = torch.rand((1000, 1000), device='mps')

print('cpu', timeit.timeit(lambda: a_cpu @ b_cpu, number=100_000))
print('mps', timeit.timeit(lambda: a_mps @ b_mps, number=100_000))
I get these results:
cpu 2.879529042
mps 14.555490040999999
Experiment 2:
a_cpu = torch.rand(2000, device='cpu')
b_cpu = torch.rand((2000, 2000), device='cpu')
a_mps = torch.rand(2000, device='mps')
b_mps = torch.rand((2000, 2000), device='mps')

print('cpu', timeit.timeit(lambda: a_cpu @ b_cpu, number=100_000))
print('mps', timeit.timeit(lambda: a_mps @ b_mps, number=100_000))
I get these results:
cpu 27.44199425
mps 14.717086125000002
mps stayed almost exactly the same.
Torch version: 1.13.0.dev20220827
@demosn01 currently the graphs for random ops are not cached, which is leading to un-necessary recompiles slowing the randn operations. We are actively working on it and will update here with a fix
If that's the case, each random operation would take on the order of 1000 μs (1 millisecond). After the optimization, it would take either 100 μs or 25 μs. Overhead could be reduced further to 15 μs by batching multiple commands into a command buffer, or 1 μs by using a custom Metal shader.