windrose
 windrose copied to clipboard
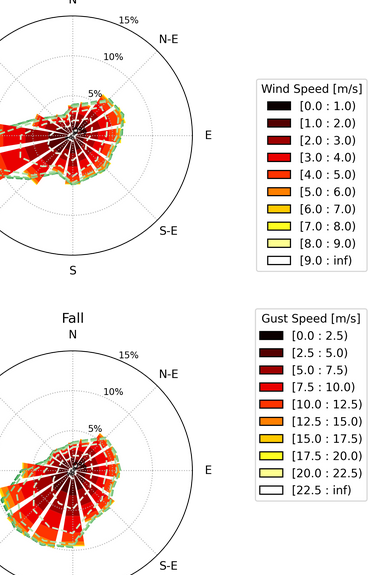
Combination plot of wind speed and gust speed
I'm trying to visualize the relationship between winds using wind speed and gust speed measurements for the same locations.
It is no problem the get the figures look correct, but I have quite some issues with the legends. It seems like one colormap is dominating and simply overwrites the other. The legend called 'Gust Speed [m/s]' should actually follow the colormap called Summer, which has not red-tones.
Here a part of the code showing how the figures are created (in this case the lower right) and how I create the legends.
f4 = fig.add_subplot(224, projection='windrose')
f4.set_title('Fall')
ws = f4.bar(df['Wind Direction'][df.index.month.isin([10,11])],
            df['Wind Speed'][df.index.month.isin([10,11])],
            normed=True,
            bins=np.arange(0, 10, 1),
            cmap=cm.autumn,
           )
l1 = f4.legend(ws, title='Wind Speed [m/s]',
           bbox_to_anchor=(1.3,0.9),
           bbox_transform=fig.transFigure
          )

gs = f4.contour(df['Wind Direction'][df.index.month.isin([10,11])],
           df['Gusts Speed'][df.index.month.isin([10,11])],
           normed=True,
           alpha=1,
           bins=np.arange(0, 25, 2.5),
           cmap=cm.summer,
           lw=1.5,
           linestyle='--',
           label='Wind Gusts',
          )

# Legends
f4.legend(gs, title='Gust Speed [m/s]',
          bbox_to_anchor=(1.3, 0.5),
          bbox_transform=fig.transFigure
          )
f4.add_artist(l1)
What would be the proper way to get the seconds legend "Gust Speed" show the right colors? It could actually also be a matplotlib issues, but I'm not sure about that.
I don't think windrose officially supports multiple plots on one axe.
windrose's bar and contour methods return None, unlike matplotlib's bar and countor methods.
In other words, ws and gs in your sample code are None.
Your point about overwriting the color bar is correct, I think.
I don't recommend it, but there are workarounds like this.
f4 = fig.add_subplot(224, projection='windrose')
f4.set_title('Fall')

f4.bar(df['Wind Direction'][df.index.month.isin([10,11])],
            df['Wind Speed'][df.index.month.isin([10,11])],
            normed=True,
            bins=np.arange(0, 10, 1),
            cmap=cm.autumn,
           )
f4.set_legend(title='Wind Speed [m/s]',
           bbox_to_anchor=(1.3,0.9),
           bbox_transform=fig.transFigure
          )

# avoid overwriteing.
plt.gca().add_artist(f4.legend_)
f4.patches_list = []

f4.contour(df['Wind Direction'][df.index.month.isin([10,11])],
           df['Gusts Speed'][df.index.month.isin([10,11])],
           normed=True,
           alpha=1,
           bins=np.arange(0, 25, 2.5),
           cmap=cm.summer,
           lw=1.5,
           linestyle='--',
           label='Wind Gusts',
          )

# Legends
f4.set_legend(title='Gust Speed [m/s]',
          bbox_to_anchor=(1.3, 0.5),
          bbox_transform=fig.transFigure
          )
Thanks @15b3 for the tip. I have not noticed that actually.
I will open it as an issue, so that combination plotting will be possible some day in the future.
I don't recommend it, but there are workarounds like this.
Indeed. The current way to draw the contours and other patches do not support that. Your workaround is probably the best we can do, or place the figures in different objects. I'm closing this as answered but if someone has a better solution please send a PR!