Increasing the fontsize of the direction labels around the wind rose
Hello! I would like to increase the font size of the direction labels (N, N-E, ...) that are around the wind rose. How could I do so? I am using (ax=WindroseAxes.from_ax())
Hi nalfahel!
It seems developers are not answering yet. Here you have a solution which I recommend you to use whenever you plot something with matplotlib:
import matplotlib.pyplot as plt
fig = plt.figure(figsize=(15,20)) SMALL_SIZE = 10 MEDIUM_SIZE = 12 BIGGER_SIZE = 15 plt.rc('font', size=MEDIUM_SIZE) # controls default text sizes plt.rc('axes', titlesize=SMALL_SIZE) # fontsize of the axes title plt.rc('axes', labelsize=SMALL_SIZE) # fontsize of the x and y labels plt.rc('xtick', labelsize=SMALL_SIZE) # fontsize of the tick labels plt.rc('ytick', labelsize=SMALL_SIZE) # fontsize of the tick labels plt.rc('legend', fontsize=SMALL_SIZE) # legend fontsize plt.rc('figure', titlesize=BIGGER_SIZE) # fontsize of the figure title
By adding this piece of code you'll have full control over size matters.
Regards.
Hello!
No ... I have not heard from them. Because I was in a rush to publish a paper back in March, I could not wait for an answer and cheated a little bit... By overprinting ... I created patches and positioned them on top of the self generated labels. If your figure size is the same as mine, I could happily share my code with you!
Let me know, Regards,
Nicolas.
On Thu, Jun 25, 2020, 10:37 PM BrianaKay [email protected] wrote:
I tried this approach rabaneda but with no luck, do the developers have any other suggestions on how to increase the tiny fontsize of the direction and the percentages within the windrose
— You are receiving this because you authored the thread. Reply to this email directly, view it on GitHub https://github.com/python-windrose/windrose/issues/130#issuecomment-649918096, or unsubscribe https://github.com/notifications/unsubscribe-auth/ALRLOSYOVADHYGSEZDWDDZTRYQCVNANCNFSM4LWCI3SQ .
I figured it out, the second that I actually posted the comment. That's how it goes, you finally ask for help and then don't need it. I actually had another question though, how to change the figure size. The function has a default size of (8,8) and tried to change it because I have a two line title that is being cut-off at the top.
On Fri, Jun 26, 2020 at 6:45 AM nalfahel [email protected] wrote:
Hello!
No ... I have not heard from them. Because I was in a rush to publish a paper back in March, I could not wait for an answer and cheated a little bit... By overprinting ... I created patches and positioned them on top of the self generated labels. If your figure size is the same as mine, I could happily share my code with you!
Let me know, Regards,
Nicolas.
On Thu, Jun 25, 2020, 10:37 PM BrianaKay [email protected] wrote:
I tried this approach rabaneda but with no luck, do the developers have any other suggestions on how to increase the tiny fontsize of the direction and the percentages within the windrose
— You are receiving this because you authored the thread. Reply to this email directly, view it on GitHub < https://github.com/python-windrose/windrose/issues/130#issuecomment-649918096 , or unsubscribe < https://github.com/notifications/unsubscribe-auth/ALRLOSYOVADHYGSEZDWDDZTRYQCVNANCNFSM4LWCI3SQ
.
— You are receiving this because you commented. Reply to this email directly, view it on GitHub https://github.com/python-windrose/windrose/issues/130#issuecomment-650188044, or unsubscribe https://github.com/notifications/unsubscribe-auth/AQCTCFJH74UHWK6SHQ2FTITRYSRBDANCNFSM4LWCI3SQ .
-- Briana Phillips
Operational Meteorologist
NOAA/NWS/WFO Portland, ORNational Weather Service5241 NE 122nd Ave Portland, OR 97230(503) 261-9246
Could you post your code then? :) About your other question... How do you define your plot? It would be cool if you could send me your code so I see how you try to fix your problem!
On Fri, Jun 26, 2020, 12:16 PM BrianaKay [email protected] wrote:
I figured it out, the second that I actually posted the comment. That's how it goes, you finally ask for help and then don't need it. I actually had another question though, how to change the figure size. The function has a default size of (8,8) and tried to change it because I have a two line title that is being cut-off at the top.
On Fri, Jun 26, 2020 at 6:45 AM nalfahel [email protected] wrote:
Hello!
No ... I have not heard from them. Because I was in a rush to publish a paper back in March, I could not wait for an answer and cheated a little bit... By overprinting ... I created patches and positioned them on top of the self generated labels. If your figure size is the same as mine, I could happily share my code with you!
Let me know, Regards,
Nicolas.
On Thu, Jun 25, 2020, 10:37 PM BrianaKay [email protected] wrote:
I tried this approach rabaneda but with no luck, do the developers have any other suggestions on how to increase the tiny fontsize of the direction and the percentages within the windrose
— You are receiving this because you authored the thread. Reply to this email directly, view it on GitHub <
https://github.com/python-windrose/windrose/issues/130#issuecomment-649918096
, or unsubscribe <
https://github.com/notifications/unsubscribe-auth/ALRLOSYOVADHYGSEZDWDDZTRYQCVNANCNFSM4LWCI3SQ
.
— You are receiving this because you commented. Reply to this email directly, view it on GitHub < https://github.com/python-windrose/windrose/issues/130#issuecomment-650188044 , or unsubscribe < https://github.com/notifications/unsubscribe-auth/AQCTCFJH74UHWK6SHQ2FTITRYSRBDANCNFSM4LWCI3SQ
.
-- Briana Phillips
Operational Meteorologist
NOAA/NWS/WFO Portland, ORNational Weather Service5241 NE 122nd Ave Portland, OR 97230(503) 261-9246
— You are receiving this because you authored the thread. Reply to this email directly, view it on GitHub https://github.com/python-windrose/windrose/issues/130#issuecomment-650265559, or unsubscribe https://github.com/notifications/unsubscribe-auth/ALRLOS373LFZDHFOCQZJ5QLRYTCULANCNFSM4LWCI3SQ .
plt.figure(2) plt.figure(figsize=(20,20))
SMALL_SIZE = 10 MEDIUM_SIZE = 20 BIGGER_SIZE = 15 plt.rc('font', size=MEDIUM_SIZE) # controls default text sizes plt.rc('axes', titlesize=MEDIUM_SIZE) # fontsize of the axes title plt.rc('axes', labelsize=MEDIUM_SIZE) # fontsize of the x and y labels plt.rc('xtick', labelsize=MEDIUM_SIZE) # fontsize of the tick labels plt.rc('ytick', labelsize=MEDIUM_SIZE) # fontsize of the tick labels plt.rc('legend', fontsize=MEDIUM_SIZE) # legend fontsize plt.rc('figure', titlesize=BIGGER_SIZE) # fontsize of the figure title
ax = WindroseAxes.from_ax() table = ax._info['table'] wd_freq = np.sum(table, axis=0) ax.bar(sig_d_gwes, sig_s_gwes, normed=True, opening=1.0, edgecolor='black', nsector=25, lw=2, cmap=mpl.cm.inferno, bins=4) ax.legend(prop={'size':15}, fontsize=15) ax.set_title('Swell height (m) and direction \n test')
On Fri, Jun 26, 2020 at 9:30 AM nalfahel [email protected] wrote:
Could you post your code then? :) About your other question... How do you define your plot? It would be cool if you could send me your code so I see how you try to fix your problem!
On Fri, Jun 26, 2020, 12:16 PM BrianaKay [email protected] wrote:
I figured it out, the second that I actually posted the comment. That's how it goes, you finally ask for help and then don't need it. I actually had another question though, how to change the figure size. The function has a default size of (8,8) and tried to change it because I have a two line title that is being cut-off at the top.
On Fri, Jun 26, 2020 at 6:45 AM nalfahel [email protected] wrote:
Hello!
No ... I have not heard from them. Because I was in a rush to publish a paper back in March, I could not wait for an answer and cheated a little bit... By overprinting ... I created patches and positioned them on top of the self generated labels. If your figure size is the same as mine, I could happily share my code with you!
Let me know, Regards,
Nicolas.
On Thu, Jun 25, 2020, 10:37 PM BrianaKay [email protected] wrote:
I tried this approach rabaneda but with no luck, do the developers have any other suggestions on how to increase the tiny fontsize of the direction and the percentages within the windrose
— You are receiving this because you authored the thread. Reply to this email directly, view it on GitHub <
https://github.com/python-windrose/windrose/issues/130#issuecomment-649918096
, or unsubscribe <
https://github.com/notifications/unsubscribe-auth/ALRLOSYOVADHYGSEZDWDDZTRYQCVNANCNFSM4LWCI3SQ
.
— You are receiving this because you commented. Reply to this email directly, view it on GitHub <
https://github.com/python-windrose/windrose/issues/130#issuecomment-650188044
, or unsubscribe <
https://github.com/notifications/unsubscribe-auth/AQCTCFJH74UHWK6SHQ2FTITRYSRBDANCNFSM4LWCI3SQ
.
-- Briana Phillips
Operational Meteorologist
NOAA/NWS/WFO Portland, ORNational Weather Service5241 NE 122nd Ave Portland, OR 97230(503) 261-9246
— You are receiving this because you authored the thread. Reply to this email directly, view it on GitHub < https://github.com/python-windrose/windrose/issues/130#issuecomment-650265559 , or unsubscribe < https://github.com/notifications/unsubscribe-auth/ALRLOS373LFZDHFOCQZJ5QLRYTCULANCNFSM4LWCI3SQ
.
— You are receiving this because you commented. Reply to this email directly, view it on GitHub https://github.com/python-windrose/windrose/issues/130#issuecomment-650272726, or unsubscribe https://github.com/notifications/unsubscribe-auth/AQCTCFNX7AHLIKQKPLWTYVLRYTEK7ANCNFSM4LWCI3SQ .
-- Briana Phillips
Operational Meteorologist
NOAA/NWS/WFO Portland, ORNational Weather Service5241 NE 122nd Ave Portland, OR 97230(503) 261-9246
Hello,
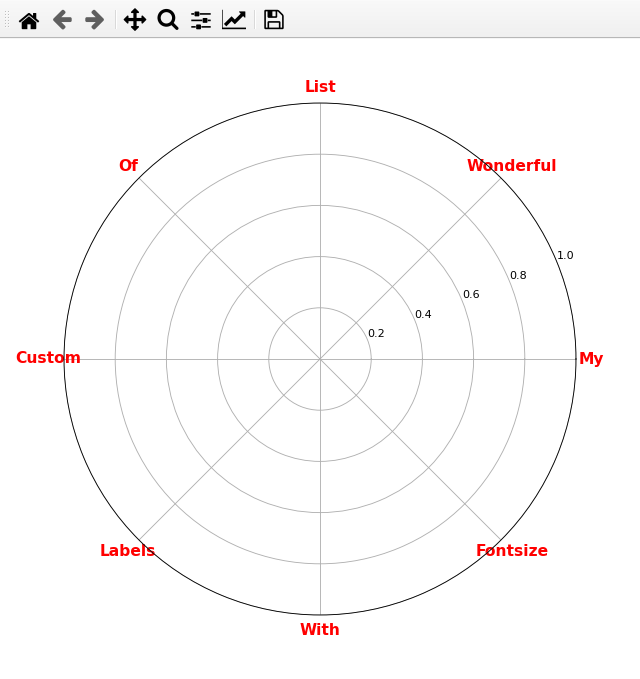
Just for completness: windrose uses regular matplotlib function and a windrose axe inherit from a PolarAxe. So every matplotlib function applies to windrose. You can then customize the tick labels as follows:
import windrose as wr

ax = wr.WindrosesAxe.from_ax()
ax.set_xticklabels(["My", "Wonderful", "List", "Of", "Custom", "Labels", "With", "Fontsize"], fontsize=14, fontweight="bold", color="red")
Or you can also keep the default label but change the formatting later on:
import windrose as wr

ax = wr.WindroseAxes.from_ax()

for t in ax.get_xticklabels():
    plt.setp(t, fontsize=14, color="red", fontweight="bold")

##  or in one line:
# ax.set_xticklabels([t.get_text() for t in ax.get_xticklabels()], fontsize=14, fontweight="bold", color="red")
You can try this:
xlabels = [i.get_text() for i in ax.get_xticklabels()]

ax.set_xticklabels(xlabels, fontsize = 20)

ylabels = [j.get_text() for j in ax.get_yticklabels()]
ax.set_yticklabels(ylabels, fontsize = 15)
It works for me and more convenient.