windrose
 windrose copied to clipboard
Scatter plot wrscatter over contourf
Hi, I'd like to overlay a wind rose made with contourf() with a wrscatter plot. This is my MWE:
import random
wind_dir = []; wind_speed = [];
for i in range(30):
    wind_dir.extend(random.sample(range(0, 359),1))
    wind_speed.extend(random.sample(range(0, 10),1))

import windrose
wd1 = np.radians([0, 45, 90, 135, 180, 225, 270, 315])
ws = [1.0, 0.4, 0.5, 0.6, 0.7, 0.8, 0.9, 0.95]
vf = np.vectorize(lambda wd: -wd + np.pi / 2)
wd = vf(wd1)

fig = plt.figure()
from windrose import WindroseAxes
plt.figure(figsize=(15,12))
ax = WindroseAxes.from_ax()
ax.contourf(wind_dir,wind_speed, bins=np.arange(0, 8, 1))
ax.set_legend()
windrose.wrscatter(wd, ws)
plt.legend(loc='center left', bbox_to_anchor=(1, 0.5),prop={'size': 20})
plt.show()
Now the two plots are separate but I'd like them to be overlain in one plot. Appreciate the help!
Hello,
You have several issue with your code. You create first 2 figures, then call the WindroseAxe.from_ax() , which also create a figure if none is passed.
Also, the wrapper windrose.wrscatter accept an ax argument, to specify on which axe you want to plot. Also, you have to specify the zorder to plot it above your contour plot. So here is the updated code:
import random
import windrose as wr

wind_dir = []; wind_speed = [];
for i in range(30):
    wind_dir.extend(random.sample(range(0, 359),1))
    wind_speed.extend(random.sample(range(0, 10),1))

wd1 = np.radians([0, 45, 90, 135, 180, 225, 270, 315])
ws = [1.0, 0.4, 0.5, 0.6, 0.7, 0.8, 0.9, 0.95]
vf = np.vectorize(lambda wd: -wd + np.pi / 2)
wd = vf(wd1)

# initialize your figure and use it to instanciate your axe
fig = plt.figure(figsize=(15,12))
ax = wr.WindroseAxes.from_ax(fig=fig)

# Plot part
ax.contourf(wind_dir,wind_speed, bins=np.arange(0, 8, 1))
windrose.wrscatter(wd, ws, ax=ax, zorder=10) # specify the ax you want to plot on. And also the Zorder to have it above the contourf

plt.legend(loc='center left', bbox_to_anchor=(1, 0.5),prop={'size': 20})
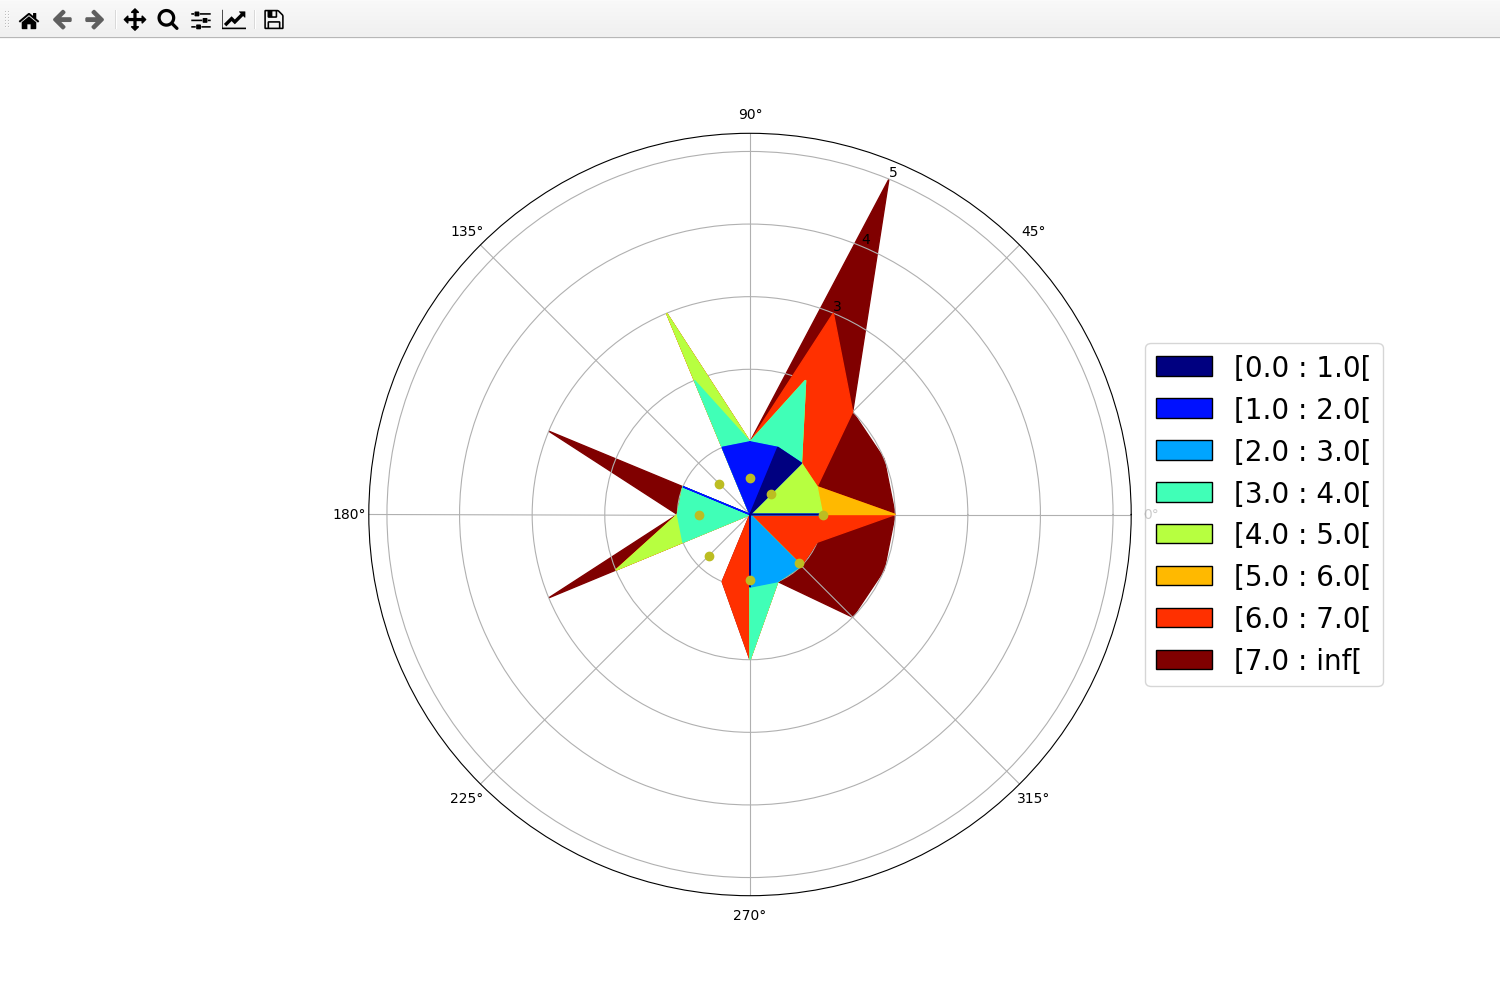
However, due to the implementation of the custom legend for the plot, it is difficult to generate a legend for both the contourf and the scatter plot. You will have to tweak it yourself.
Also, be aware that the contourf give you the probability density, so the r-axis is probability, not wind speed!