Inconsistent colors for `moran_scatterplot` and `lisa_cluster` when p values are small
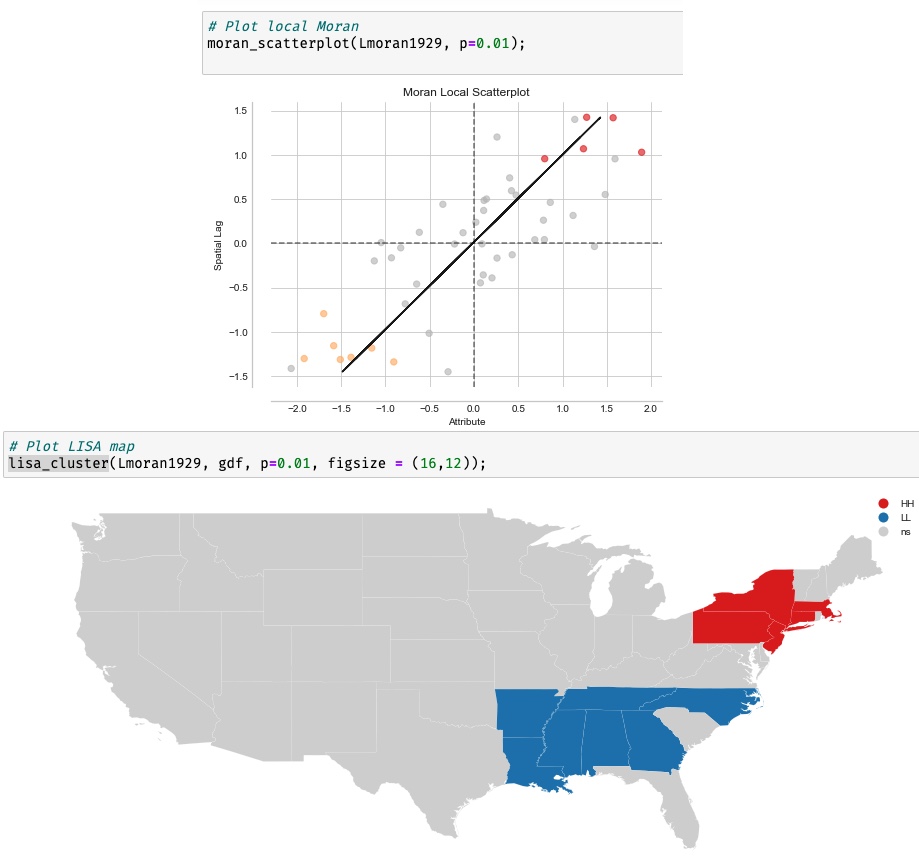
How can I make the colors of the Moran scatterplot consistent with those of the LISA cluster map when only HH and LL regions are significant?
Here is an example of the issue I am facing
This inconsistency is also present even if I use the docker container of @darribas . Here is a reproducible notebook https://deepnote.com/@carlos-mendez/Intro-to-ESDA-and-CSRA-XRMI-FfoQ1ahIUKIOicrVg#00024-b3e0c355-9428-4c58-84f5-eada14ef95a6
Here is some additional info of my local session posix darwin posix.uname_result(sysname='Darwin', nodename='Carloss-Mac-mini.local', release='19.6.0', version='Darwin Kernel Version 19.6.0: Thu Oct 29 22:56:45 PDT 2020; root:xnu-6153.141.2.2~1/RELEASE_X86_64', machine='x86_64') 3.7.9 | packaged by conda-forge | (default, Dec 9 2020, 20:58:55) [Clang 11.0.0 ] numpy 1.20.2 splot 1.1.3 Thank you in advance for your advice.
Hello @cmg777 thank you for reporting this behaviour!
This ultimately needs a fix in the source code here: https://github.com/pysal/splot/blob/22039aac9e61c8019ba7817733871a7c1091db0d/splot/_viz_esda_mpl.py#L801, to check if Lisa bins are missing and to assign the correct colours automatically in case there are Moran classification bins missing.
This problem has been resolved in the past for Lisa_cluster here https://github.com/pysal/splot/blob/22039aac9e61c8019ba7817733871a7c1091db0d/splot/_viz_esda_mpl.py#L923
For the Moran scatterplot this fix could be reused building the correct colour map using: https://github.com/pysal/splot/blob/22039aac9e61c8019ba7817733871a7c1091db0d/splot/_viz_utils.py#L24
A quick, one-off solution could be to create your own color map, from the default colours found here: https://github.com/pysal/splot/blob/22039aac9e61c8019ba7817733871a7c1091db0d/splot/_viz_esda_mpl.py#L801 and feed it into the moran_scatterplot function through the scatter_kwds argument.
If you are interested I'd be happy to guide you through committing these changes for everyone to use for the project.
` # colors spots = moran_hot_cold_spots(moran_loc, p) # hmap = colors.ListedColormap( # ["#bababa", "#d7191c", "#abd9e9", "#2c7bb6", "#fdae61"] # )
    # retrieve colors5 and labels from mask_local_auto
    _, colors5, _, labels = mask_local_auto(moran_loc, p=p)

    # define ListedColormap
    hmap = colors.ListedColormap(colors5)

# define customization
scatter_kwds.setdefault("alpha", 0.6)`
I can't fix it.
plase help me.