Idea Collection: Functionality to support in splot
Space to collect ideas which functionality to support for each sub package in splot
esda
- [ ] Choropleth functionality for each algorithm in esda.mapclassify.
- [ ] Spatial Autocorrelation:
- [x] Global Moran scatter plot (Moran_Scatterplot())
- [x] Global Moran Bivariate scatter plot (Moran_BV_Scatterplot())
- [x] Global Moran Bivariate scatter plot facetting matrix (Moran_BV_facet())
- [ ] Global Moran Rate scatter plot (Moran_Rate_Scatterplot())
- [x] Local Moran map (Moran_Local_Map())
- [x] Local Moran Bivariate map (Moran_Local_BV_Map())
- [ ] Local Moran Rate map (Moran_Local_Rate_Map())
- [ ] Local Getis-Ord map (G_Local_Map())
giddy
- [x] dynamic LISA
- [x] dynamic LISA heatmap (dynamic_lisa_heatmap(rose))
- [x] dynamic LISA rose diagrams (dynamic_lisa_rose(rose))
- [x] dynamic LISA vectors (dynamic_lisa_vectors(rose))
- [x] dynamic LISA composite plot (dynamic_lisa_composite(rose, gdf))
- [x] dynamic LISA interactive composite plot (dynamic_lisa_composite_explore(rose, gdf))
- [ ] LIMA
spreg
splot.vba
- [x] value by alpha maps: http://andywoodruff.com/blog/value-by-alpha-maps/
- change RGB -> alpha, plug to mpl (Paper)
core splot
- [ ] BV and TriV choropleths
- [ ] BV LISA matrix
- [ ] Triangles for BiVAriate choropleths
- [ ] conditional map
- [ ] facets (prototype example)
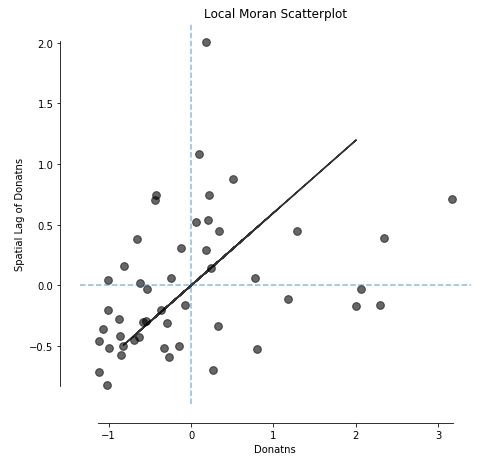
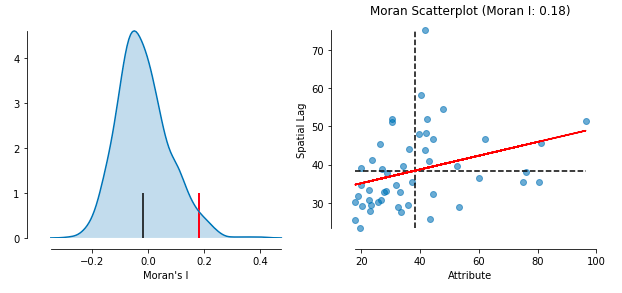
I am playing with different visualisations for all esda.moran objects at the moment. The moran_loc_scatterplot() so far displays standardised attribute values and corresponding spatial lag values (Moran_loc.z). I was wondering if it would make sense to also give an option ((standardized=False,...)) for non-standardised values in the scatterplot, displaying the actual attribute values and their spatial lag. I am not sure if this would be of use?
I would like to try and implement this scatterplot blueprint (+ additional visualizations) for all esda.moran objects (Moran_Local, Moran, Moran_BV,...) in the next two weeks. If I implement standardised values for all scatterplots, does Moran_BV also have an .z argument or something similar?
What do you think @sjsrey @TaylorOshan @darribas @ljwolf
Scatterplot with real-attribute values
scatterplot with (z-) standardised values: