Explaining xarray in a single picture
What is your issue?
Hi folks, I'm working on a mini-tutorial introducing xarray for some folks in our genetics community and noticed something slightly confusing about the typical pictures used to help describe what xarray is for.
E.g., this picture is commonly used:
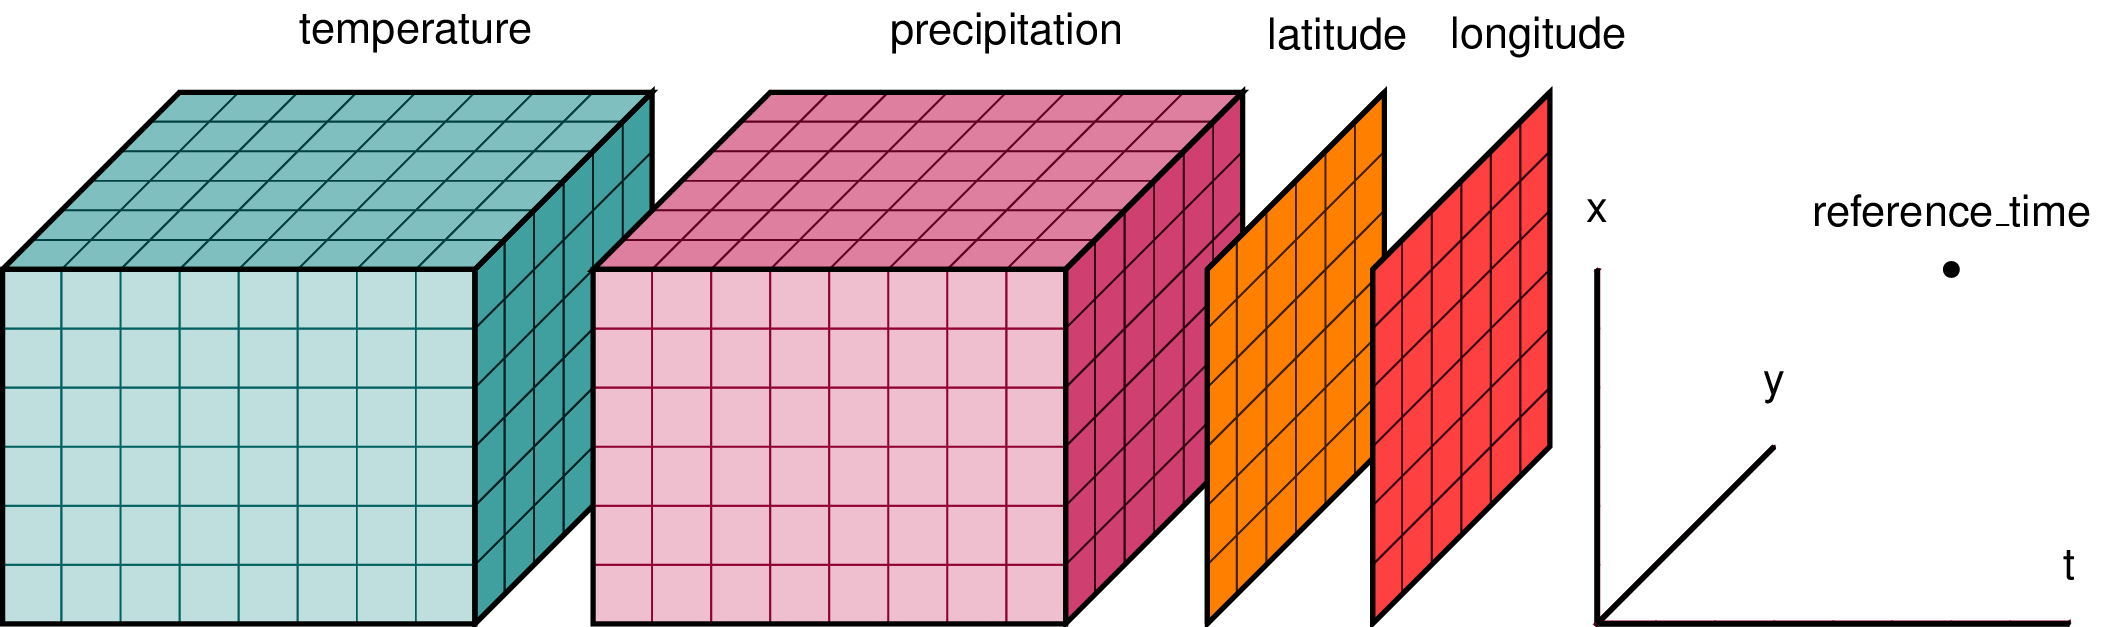
I get that temperature and precipitation are data variables which have been measured over the three dimensions of latitude, longitude and time. But I'm slightly confused here because I would've thought that latitude and longitude would be 1-dimensional coordinate variables, yet they are drawn as 2-D arrays?
Elsewhere I found a slightly different version:

This makes more sense to me, because here the 2-D arrays have been labeled as "elevation" and "land_cover", and thus these are variables which are measured over the dimensions of latitude and longitude but not time, hence 2-D. Also, here latitude, longitude and time are shown labelling the dimensions, which again makes a bit more sense. However, "elevantion" and "land_cover" are included within the "coordinates" bracket, and I would have thought that elevation and land_cover would be more naturally considered as data variables?
Feel free to close/ignore/set me straight if I'm missing something here, but just thought I would raise to say that I was looking for a simple picture to help me explain what xarray is all about for newcomers and found these existing pictures a little confusing.
Hi @alimanfoo, thanks for raising this.
I would've thought that latitude and longitude would be 1-dimensional coordinate variables, yet they are drawn as 2-D arrays?
I think that if you assume that the axes of your grid data align with the cardinal directions (East-West / North-South) then you would expect latitude and longitude to be 1D, but if they don't align then the coordinates would need be 2D (i.e. if x and y are merely arbitrary lines along the Earth's surface).
I agree with you though that 2D lat/lon grids are unnecessarily confusing, especially for non-geoscience users.
I like the second diagram you showed more (it's also a neater version of the labelled one I made here). I think it's debatable whether elevation and land_cover constitute coordinates or data variables, but I have no strong opinion on that.
As for improvements, I think it would be clearer to at least use the second image over the first, and perhaps we could improve it further.
I'm working on a mini-tutorial introducing xarray for some folks in our genetics community
We are currently reworking https://tutorial.xarray.dev/intro.html and would love to either add your material or link to it if you're creating a consolidated collection of genetics-related material. xref (https://github.com/pydata/xarray/issues/3564). We don't have a "domain-specific" section yet but are planning to create one after SciPy.
Whilst trying to use this figure to explain our data model to someone at SciPy I realised that we also need separate versions of this figure for just a DataArray / Variable too, because new users struggle to understand which parts of this diagram are still present in a single DataArray / Variable.
Hi @TomNicholas,
I would've thought that latitude and longitude would be 1-dimensional coordinate variables, yet they are drawn as 2-D arrays?
I think that if you assume that the axes of your grid data align with the cardinal directions (East-West / North-South) then you would expect latitude and longitude to be 1D, but if they don't align then the coordinates would need be 2D (i.e. if x and y are merely arbitrary lines along the Earth's surface).
I agree with you though that 2D lat/lon grids are unnecessarily confusing, especially for non-geoscience users.
Interesting, I hadn't considered that. Definitely a bit mind-bending though for us non-geoscientists :)
I like the second diagram you showed more (it's also a neater version of the labelled one I made here). I think it's debatable whether
elevationandland_coverconstitute coordinates or data variables, but I have no strong opinion on that.As for improvements, I think it would be clearer to at least use the second image over the first, and perhaps we could improve it further.
SGTM. FWIW on the second diagram I would use "dimensions" instead of "indexes". Getting dimensions first then helps to explain how you can use a coordinate variable to index a dimension.
Hi @dcherian,
We are currently reworking https://tutorial.xarray.dev/intro.html and would love to either add your material or link to it if you're creating a consolidated collection of genetics-related material. xref (#3564). We don't have a "domain-specific" section yet but are planning to create one after SciPy.
FWIW we've created a short tutorial on xarray which is meant as a gentle intro to folks coming from the malaria genetics field. We illustrate xarray first using outputs from a geostatistical model of how insecticide-treated bednets are used in Africa. We then give a couple of brief examples of how we use xarray for genomic data. There's video walkthroughs in French and English:
https://anopheles-genomic-surveillance.github.io/workshop-5/module-1-xarray.html
Please feel free to link to this in the xarray tutorial site if you'd like to :)