pycaret
 pycaret copied to clipboard
Published
20 hours ago •
 pycaret
Request to add anomaly detection plots for anomaly detection module
trafficstars
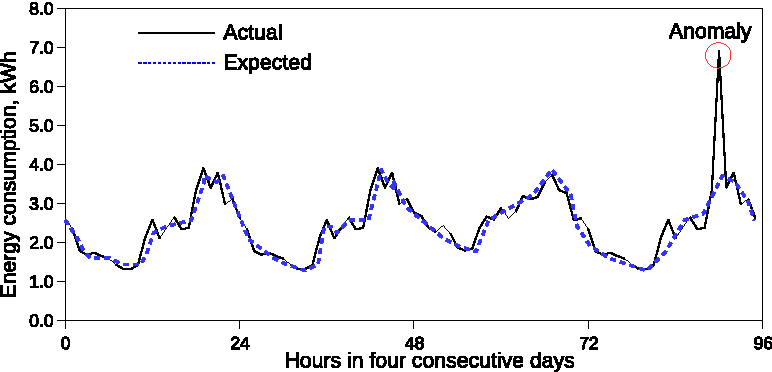
Hi pycaret team! I know pycaret supports anomaly detection. what i'm proposing is that I want to visualize the anomalies in time series format plots. I have seen only label anomaly detection in pycaret. My proposal plots are below, When I give plot_model for anomaly, it has to provide following plots. First plot for assigned anomaly. Second plot is for predicted one on unseen data(new data)

Hi Pycaret team, Is the above requested feature currently available in anomaly detection module?