Non-linear causal relationships
I have been using doWhy with some data for which the relationship between cause and effect is not a straight line. My treatment variable is called L1 and I have an effect modifier, g. There are no confounders here, and my identified estimand is L1+L1*g. Using backdoor.linear_regressions as an estimator gives the coefficients.
      const    17.495757
      x1       -0.004714
      x2       -0.046194
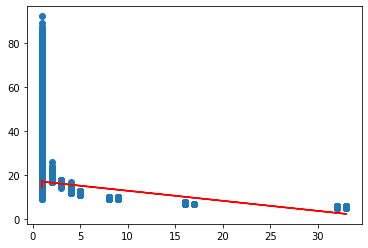
I think this corresponds to 17.495757 + (-0.004714 * L1) + (-0.046194 * L1 * g), but this is a straight line, as shown in the following graph. The scatter plot shows the actual data (L1 on x, outcome on y), and the red line represents the estimator from doWhy. Actually it's a flat plane, I guess, but a straight line when you only view L1 and the outcome.
I appreciate that backdoor.linear_regression is probably not the best estimator to use for this as the actual relationship is in sqrt(x), but the more advanced estimators from EconML don't really do any better and I can get a reasonably OK fit in either L1^3 or L1^4 using scikit learn. I wondered how/whether it is possible to use dowhy for such non-linear relationships?
That's an interesting question. A simple answer is to pre-process your variables. E.g., you can transform L1 to sqrt(L1) or L1^2 before passing it to DoWhy.
However, non-linear methods should be able to do this automatically. I'm surprised that the EconML methods did not work. Can you share which ones you tried? If you can share some sample data/generation code, I can try to reproduce this.
Thanks for getting back to me on this. For the simple solution, would I need to include sqrt(L1) etc. as an additional treatment (and variable in the causal model) to get it to pick it up in the estimand? This feels a little uncomfortable since sqrt(L1) is, intuitively, not a separate treatment.
For EconML, I tried both backdoor.econml.dml.DML and backdoor.econml.dml.CausalForestDML both of which produce effect estimates which are incorrect by many orders of magnitude. I'm expecting the estimate for control value 1 and treatment value 2 to be around -8, and both give me estimates of order 10^12! I also tried backdoor.generalized_linear_model with all of the available families. Most produce estimates which are in the correct order of magnitude, but most are still way off (relatively speaking).
Here's the CSV file, causal DAG, and a minimal python script to calculate the estimates. I had to change the extensions of the latter two to allow git to upload them.
rct_data.csv
abstract.txt (change extension back to .dot)
estimates-mwe.txt (change extension back to .py)
thanks. Since this seems to be connected to EconML methods, I'm also tagging @moprescu from the EconML team who may be able to help.