EconML
 EconML copied to clipboard
How do I get the actual treatment variables in the output instead of T0 and T1?
@gregorybchris @kbattocchi Hi, I have this output:
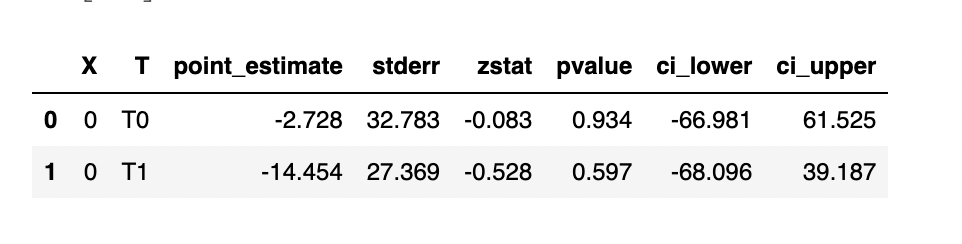 However, I am not sure what the T0 and T1 map to? My two treatment features are both integers from 0-10. How do I know what the combination (actual values) of treatment 1 and treatment 2 is which is behind T0 and T1? Or am I misunderstanding and these T0 and T1 mean just an increase in 1 unit of that treatment? Please clarify. Thanks
Could you provide a little bit more context on what method you called and what the arguments were to produce that output?
@kbattocchi I guess, I want to first understand how to read this output. Maybe that will answer my question.
- Does this say that for 1 increase in Treatment 0, my outcome variable will drop by -2.78 on average?
- If that is so, is that assuming a linear relationship between treatment and outcome? How does that apply to use cases where increasing the price of a product (treatment) has impact on sales (outcome)? There are some customers who may not be as price-sensitive initially (increasing a few bucks) but at some point they will and some are sensitive even increasing the price to any small incremental level...thus, a linear relationship seems not true...
Can you clarify please? That would really help.
Most of our estimators assume a linear relationship between the treatment(s) and outcome(s), conditional on the features. As you note, this may not be realistic, particularly over a wide range of treatments; in that case you may be able to use a transformed version of your treatment and outcome spaces (e.g. using log(quantity) and log(price) would let you estimate a constant price elasticity rather than a linear relationship between quantity and price) or you could a polynomial expansion of your treatment(s) to include higher-order or interaction terms.
However, again to precisely describe how to interpret those results, it would be helpful if you explained how you generated them - is that the output of const_marginal_effect_inference? If so, it is saying that for whatever the features were in row 0, increasing your first treatment by 1 unit will lower output by ~2.7 units, while increasing the second treatment by 1 unit will lower output by ~14.5 units.
@kbattocchi This makes a lot of sense now. And yes, it is the object causal_forest.const_marginal_effect_inference(X_test) that produced the output of discussion. Thanks a ton!
Just to ensure I understand the application of your comment: Does that mean if I increase Treatment1 by 25 units, the effect on the outcome will be 25* (-2.7)? Or is the effect calculated differently where the model will understand that increasing the Treatment between 1-3 units will lower outcome by -2.7 but applying Treatment between 4-10 will lower outcome by some other factor? If so, is the -2.7 in our example the average (across different sensitivity levels)?
Lastly, I wanted to check on model performance: Given the nature of not having ground truth (my understanding is we are computing counter-factuals), how can we measure performance in first place with confidence intervals? Am I misunderstanding something here?
@kbattocchi Could you help me close the loop on this ticket please? I wanted to confirm my understanding and hope you can help. thanks a ton!
Yes, that estimator assumes a constant marginal treatment effect, so the total effect will just be the marginal effect times the change in treatment (25 * (-2.7) in your case).
You are also correct that one fundamental challenge in causal inference is that unlike with predictive models, we do not have ground truth and so we cannot do something like measure performance on a held out data set. The confidence intervals are computed assuming that the causal model is correctly specified and that your first stage models are good (your first stage models are predictive models, and you can see their scores on out-of-sample data using the nuisance_scores_t and nuisance_scores_y attributes, but that still doesn't tell you if your models are "good enough", because you actually want some unpredictable variation in T that serves as a "found experiment" that lets us learn the treatment effect).
@kbattocchi Interesting and makes so much sense! As far as the marginal effect times the change in treatment (25 * (-2.7) in my case goes, is there a way to specify that there is no way that an infinite linear increase is possible due to point of diminishing returns? I.e. if you increase the price of a good, there will be a point in which the slope of the profit will decrease. I have seen other orthoMLmodels that do something like this (i.e. add a constraint):
monotone_constraints = [-1 if col == T else 0 for col in X+[T]]
model_final = LGBMRegressor(max_depth=3, monotone_constraints=monotone_constraints)
Do you have something like this for EconML as well?