pwndbg
 pwndbg copied to clipboard
Highlight frame info & step difference
After trying voltron with Binary Ninja for one day and coming straight back to pwndbg (my favorite gdb extension), I realized why I switched. It was not for the Binary Ninja integration, it was because it clearly showed saved EBP/RBP/EIP/RIP on the stack with a background highlight and a highlighted diff of any changed values between steps. (Example from the Binary Ninja dynamic analysis setup displaying this UI - https://youtu.be/egTjMki3GQ4?t=326)
This subtle UX feature removed a cognitive step in exploitation when identifying the distance between the input buffer and saved instruction pointer.
Another example similar to this with colored diffs and value highlighting is @geohot's qira.
This feature request is two-part. The first is to add highlighted background to frame info such as base pointer and instruction pointer (This could start as an annotation next to the pointer on the stack similar to esp/rsp). The second would be a diff between the previous view state and the current view state showing highlighted values where values have changed.
Hopefully this wouldn't be a huge change, the annotated stack seems like the easiest place to start if this feature is desired.
Hey,
Thanks for the issue!
I totally like this feature, however how can we detect if there is saved frame/instruction pointer?
@vitapluvia Would you prepare a PR with such feature? Or is it just a feature request? :P
Right now we highlight all registers that change between any two program states by putting an asterisk * next to them.
For memory differences, it's not clear to me when the Binary Ninja plugin you linked thinks is "before" and "after". Is it on each step?
This is something we could do somewhat automatically with hexdump which gets us easy wins elsewhere, but integrating it into other commands would be difficult (chain being the most useful example).

Sorry for the late reply! Work has been busy, and haven't had a chance to look further into this issue.
@disconnect3d it is just a feature request because I couldn't find the area to change within pwndbg 😄
After going through some pwnables recently, I realized it would be easier to highlight memory based on regex instead of tracking each value. To do this, I've found a nice work-around using iTerm2.
I'm using their Trigger functionality to dynamically highlight regions of memory and user controlled data markers such as 0x41414141. In this case it's highlighting the current heap page, three user controlled values, and a target function pointer (0x0804862b):

Since it's applied globally it also works in any pwndbg view such as the heap command:
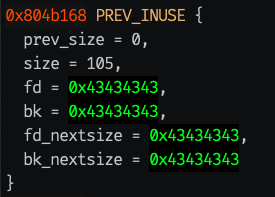
To get this working, I've set the following regular expressions to trigger the highlight automatically when the values are found:

It would be nice if this functionality was in pwndbg, as it's been very useful when quickly identifying values, but iTerm2 works for now!
Also the Qira-like diffing sounds a little too intense for a pwndbg feature. If anything it would make more sense to integrate with a tool such as rr to help visualize changes between recorded states.