contour label does not work well in geographic projections
Description
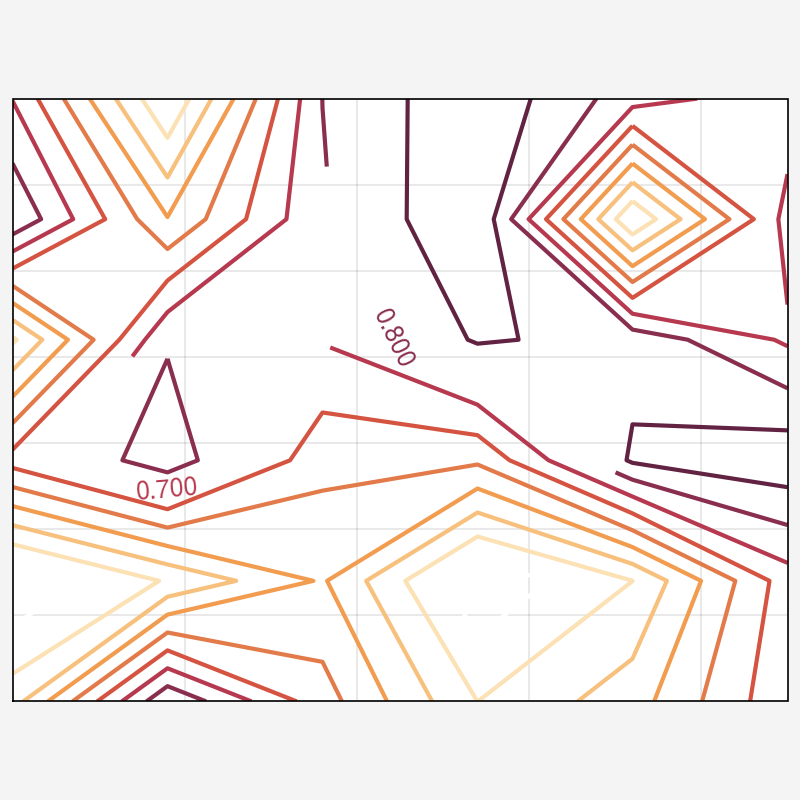
I wanted to plot a contour map in a geographic projection, and the plotting went just fine. However, when I tried to add labels to contours, the results were quite confusing.
Steps to reproduce
A "Minimal, Complete and Verifiable Example" will make it much easier for maintainers to help you.
# your code here
# we should be able to copy-paste this into python and exactly reproduce your bug

import proplot as pplt
import pandas as pd
import numpy as np

state = np.random.RandomState(51423)
data = state.rand(6, 6)
data = pd.DataFrame(data, index=pd.Index(['a', 'b', 'c', 'd', 'e', 'f']))

lat = np.linspace(40, 5, 6)
lon = np.linspace(90, 135, 6)

fig = pplt.figure(
    refwidth = 4.5,
    )
ax = fig.subplots(
    proj = 'cyl',
    )
ax.contour(
    lon,
    lat,
    data,
    labels = True,
    )
ax.format(
    lonlim = (90, 135),
    latlim = (5, 40),
    lonlines = 15,
    latlines = 10,
    lonlabels = 'b',
    latlabels = 'l',
    )
Thanks for the report, not sure what's going on here.
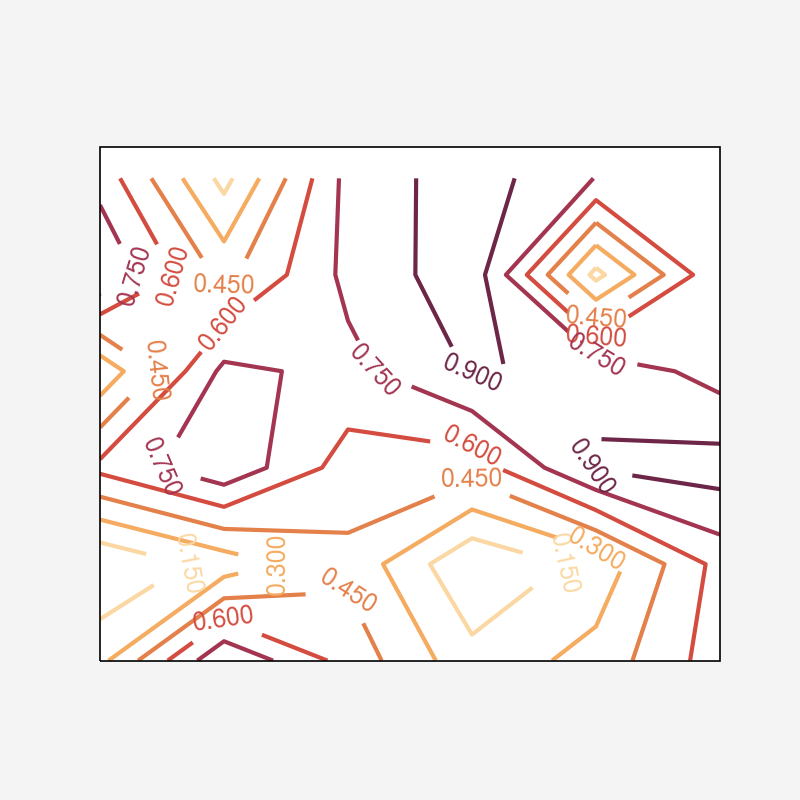
In your example, the fraction of contour lines removed for inline labels is too much:
In a matplotlib-only equivalent, a more appropriate fraction is removed:
import matplotlib.pyplot as pet
import proplot as pplt
import pandas as pd
import numpy as np

state = np.random.RandomState(51423)
data = state.rand(6, 6)
data = pd.DataFrame(data, index=pd.Index(["a", "b", "c", "d", "e", "f"]))

lat = np.linspace(40, 5, 6)
lon = np.linspace(90, 135, 6)

fig = plt.figure(
    # refwidth=4.5,
)
ax = fig.subplots(
    # proj="cyl",
    subplot_kw={"projection": pplt.PlateCarree()},
)
m = ax.contour(
    lon,
    lat,
    data,
    # labels=True,
    # labels_kw={'inline_spacing': 0},
)
ax.clabel(m, inline_spacing=0)
ax.set_extent([90, 135, 5, 40])
# ax.format(
#     lonlim=(90, 135),
#     latlim=(5, 40),
#     lonlines=15,
#     latlines=10,
#     lonlabels="b",
#     latlabels="l",
# )
This typically happens when the axes limits change after
clabelis called
Thank you for your tip. Based on your tip, I set format before displaying, and problem solved, thank you !
Thanks for the catch @jklymak. Though not sure why this seems to happen after calling clabel when adjusting limits with in proplot with lonlim/latlim, but not when adjusting limits in matplotlib/cartopy with set_extent (result of testing).
Maybe it can be improved -- will leave this open.
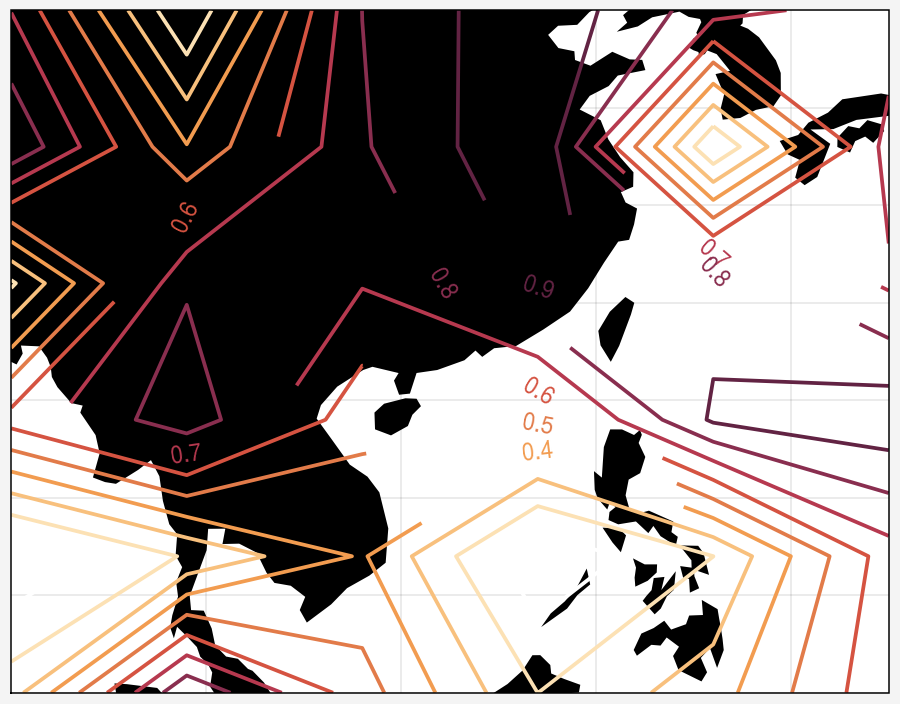
Figured it out -- this is related to proplot's default use of a global map extent, compared to cartopy's default use of map extents that conform to plotted content.
In the "dev" version, to ensure the right label spacing whether or not you set limits before/after the call to clabel, you can revert to cartopy's default behavior using pplt.rc['geo.extent'] = 'auto' or by passing fig.subplots(..., extent='auto') (note this was pplt.rc['cartopy.autoextent'] = True and fig.subplots(..., autoextent=True) in v0.9.X, but has been changed -- the old setting/keyword now raise a warning).
Here's with initial global extent:
import matplotlib.pyplot as pet
import proplot as pplt
import numpy as np
state = np.random.RandomState(51423)
data = state.rand(6, 6)
lat = np.linspace(40, 5, 6)
lon = np.linspace(90, 135, 6)
fig = pplt.figure(width=5)
ax = fig.subplots(proj='cyl', extent='globe', land=True)
m = ax.contour(lon, lat, data)
ax.clabel(m, inline_spacing=0)
ax.set_extent([90, 135, 5, 40])
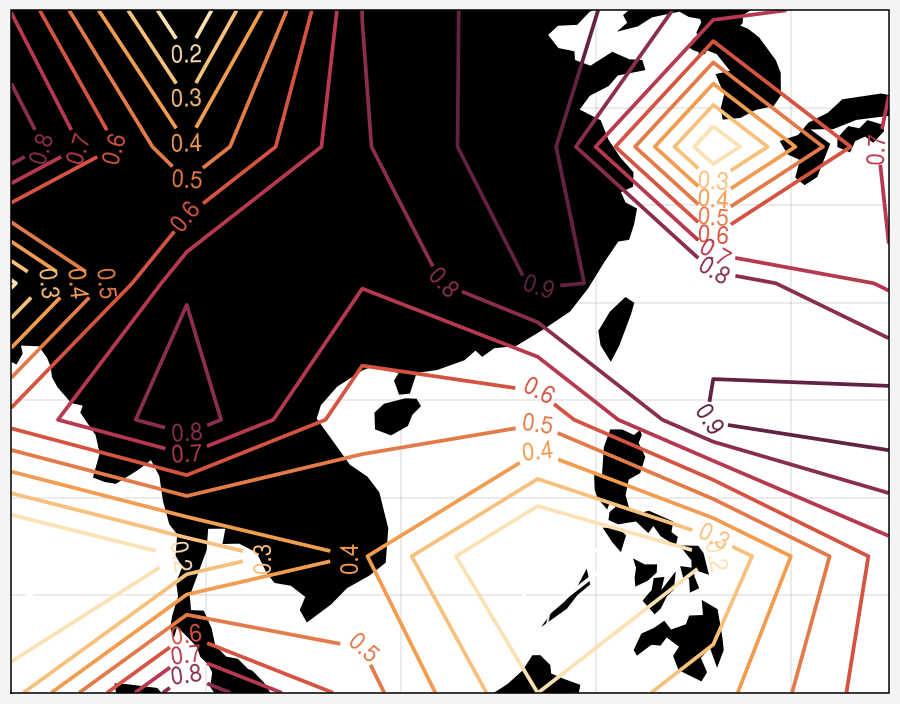
And here's with "auto" extent:
import matplotlib.pyplot as pet
import proplot as pplt
import numpy as np
state = np.random.RandomState(51423)
data = state.rand(6, 6)
lat = np.linspace(40, 5, 6)
lon = np.linspace(90, 135, 6)
fig = pplt.figure(width=5)
ax = fig.subplots(proj='cyl', extent='auto', land=True)
m = ax.contour(lon, lat, data)
ax.clabel(m, inline_spacing=0)
ax.set_extent([90, 135, 5, 40])
I think a workaround might be to delay the following set_global() call until the figure gets drawn for the first time, and then only call it if the user has not explicitly updated the lon/lat limits:
https://github.com/proplot-dev/proplot/blob/0e18babf43193a44f038928f008e873ad95f271c/proplot/axes/geo.py#L944-L952