Major ticks location is wrong for Datetime axes
Description
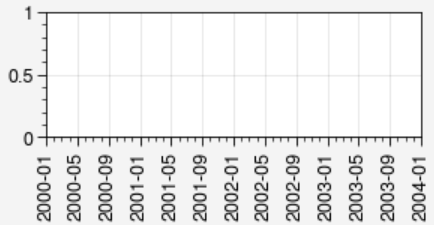
The major and minor xticks have some spaces and it looks the major one is wrong.
Steps to reproduce
import proplot as pplt
import numpy as np

fig, axs = pplt.subplots(aspect=(6,2))

axs.format(xlim=(np.datetime64('2000-01-01'), np.datetime64('2004-01-01')),
           xlocator=('month', range(1, 12, 4)))
Expected behavior: [What you expected to happen]
The major ticks are shown correctly.
Actual behavior: [What actually happened]
Proplot version
Paste the results of import matplotlib; print(matplotlib.__version__); import proplot; print(proplot.version)here.
3.5.1
0.9.5.post202
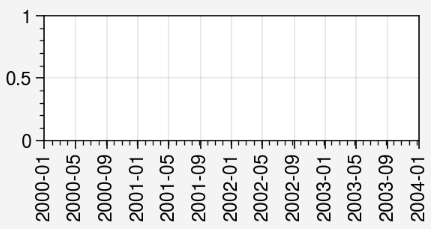
It looks like the minor ticks are specified with a numeric AutoMinorLocator instead of a special datetime locator. Hence the weird intervals... AutoMinorLocator is using the integer conversions of the datetimes.
This seems to be a matplotlib-specific issue, most likely because the default matplotlib styles don't use minor ticks so this issue crops up relatively rarely. Example:
import matplotlib.pyplot as plt
import proplot as pplt
import numpy as np
fig, ax = plt.subplots()  # aspect=(6, 2))
ax.set_xlim((np.datetime64("2000-01-01"), np.datetime64("2004-01-01")))
ax.xaxis.set_major_locator(pplt.Locator('month', range(1, 12, 4)))
print(ax.xaxis.get_minor_locator())  # result is an AutoMinorLocator, not a datetime locator like `MonthLocator`

We can improve on matplotlib's behavior for the next version by (for example) automatically setting the minor locator to monthly intervals when the major locator is correspondingly set, etc.
For now using xminorlocator='month' (or equivalently xminorlocator=('month', 1) will probably give you what you want.