ticklabels of log scale axis should be 'log' by default?
I feel it might be more natural to use 'log' for ticklabels when log scale is used.
Steps to reproduce
import proplot as pplt
fig = pplt.figure()
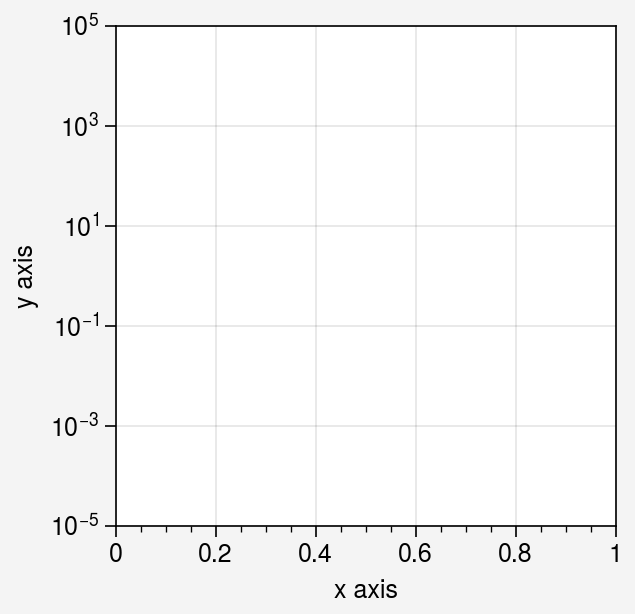
ax = fig.subplot(xlabel='x axis', ylabel='y axis')
ax.format(yscale='log', ylim=(1e-5, 1e5))
Expected behavior: [What you expected to happen]
Actual behavior: [What actually happened]

Steps for expected behavior
I can fix it by hand with yticklabels='log'
import proplot as pplt

fig = pplt.figure()
ax = fig.subplot(xlabel='x axis', ylabel='y axis')
ax.format(yscale='log', ylim=(1e-5, 1e5), yticklabels='log')
Proplot version
Paste the results of import matplotlib; print(matplotlib.__version__); import proplot; print(proplot.version)here.
3.4.3
0.9.5
Or is it possible to configure this behavior to default via rc files? I didn't see how can I do it so far.
Similar problem for symlog scale:
pplt.subplot(xscale='symlog', xlim=(-1e4, 1e4))

This behavior is intentional, just because I liked the consistency of one formatter for everything and prefer plain numbers for published figures, but it's definitely not ideal for axes spanning larger orders of magnitude.
There is currently no rc setting to change this but I like this idea. I think I'll add something like rc['formatter.log'] that can be set to False to disable the applicaton of AutoFormatter for log/symlog axes. Alternatively I could try something like rc['formatter.logthresh'] that auto-disables the application of AutoFormatter when the axis spans more than N orders of magnitude.... but the implementation of this might be too tricky.
I'll also add a note about the setting to this section of the docs, along with an example that shows the different formatters for each axis scale. Note in your example ax.format(yformatter='log') or ax.format(xformatter='symlog') would work.
...I might also consider setting the default value rc['formatter.log'] to False if my preference is in the minority. Maybe I'll start a poll like we did for import proplot as pplt.
Yes, it would be great to have something like rc['formatter.log'].
I wonder it would be quite common to meet axes spanning several orders of magnitude, that is basically why we need log scale :)