Support inset_axes zooms for all GeoAxes projections
Description
inset_axes doesn't work for geographic plots.
Steps to reproduce
import proplot as plot

f, axs = plot.subplots(
    ncols=2, axwidth=2.5,
    proj='robin', proj_kw={'lon_0': 180}
)
axs.format(
    suptitle='Figure with single projection',
    coast=True, latlines=30, lonlines=60
)

axi = axs.inset(
    [0, 0, 10, 10], transform='data', zoom=True,
    zoom_kw={'color': 'red3', 'lw': 2}
)
Error
Traceback (most recent call last):
  File "test_del.py", line 16, in <module>
    zoom_kw={'color': 'red3', 'lw': 2}
  File "/yin_raid/xin/miniconda3/envs/python37/lib/python3.7/site-packages/proplot/subplots.py", line 217, in _iterator
    ret.append(func(*args, **kwargs))
  File "/yin_raid/xin/miniconda3/envs/python37/lib/python3.7/site-packages/proplot/axes.py", line 1334, in inset_axes
    bb = locator(None, None)
  File "/yin_raid/xin/miniconda3/envs/python37/lib/python3.7/site-packages/proplot/axes.py", line 348, in inset_locator
    bb = mtransforms.TransformedBbox(bbox, trans)
  File "/yin_raid/xin/miniconda3/envs/python37/lib/python3.7/site-packages/matplotlib/transforms.py", line 1005, in __init__
    raise ValueError("'transform' must be an instance of "
ValueError: 'transform' must be an instance of 'matplotlib.transform.Transform'
Proplot version
0.5.0
This is actually not an advertised feature but it's on my to-do list under the category "make XYAxes features work with rectangular projections like Mercator and Plate Carrée". See #131 for details.
Will leave this issue open as a feature request for now. As a workaround you can probably make your own inset axes using the default cartopy API with e.g.
import cartopy.crs as ccrs
ax = fig.add_axes([x0, x1, y0, y1], projection=ccrs.PlateCarree())
ax.set_extent([lon0, lon1, lat0, lat1])
<plotting_code_here>
@lukelbd
I tried this feature again:
import proplot as pplt
import cartopy.crs as ccrs

pplt.rc.reso = 'med'
fig, axs = pplt.subplots(proj='pcarree')
axs.scatter(120, 30)

bounds = (1, 1, 1, 1)
# bounds = (118, 28, 4, 4)

axs.inset(bounds, proj='pcarree',
          zoom=True,
         zoom_kw={'color': 'red3', 'lw': 2, 'ls': '--'}
         )

axs.format(coast=True, lonlim=(100, 130), latlim=(15, 40))

The bounds are relative to axis, is it possible to use lon and lat?
If I set transform='data', I got this error:
~/new/miniconda3/envs/pyresample_min/lib/python3.8/site-packages/matplotlib/cbook/__init__.py in _check_isinstance(_types, **kwargs)
   2244     for k, v in kwargs.items():
   2245         if not isinstance(v, types):
-> 2246             raise TypeError(
   2247                 "{!r} must be an instance of {}, not a {}".format(
   2248                     k,

TypeError: 'transform' must be an instance of matplotlib.transforms.Transform, not a cartopy.crs.PlateCarree
In v0.7 I try to translate transform='data' into transform=ccrs.PlateCarree() so that you can position with longitude-latitude bounds rather than map projection bounds... but I guess matplotlib's axes positioning system can't handle cartopy transforms like its plotting commands can.
You can use transform=ax.transData instead for now -- since you're using the Plate Carrée projection, "map projection coordinates" are equivalent to longitude-latitude coordinates
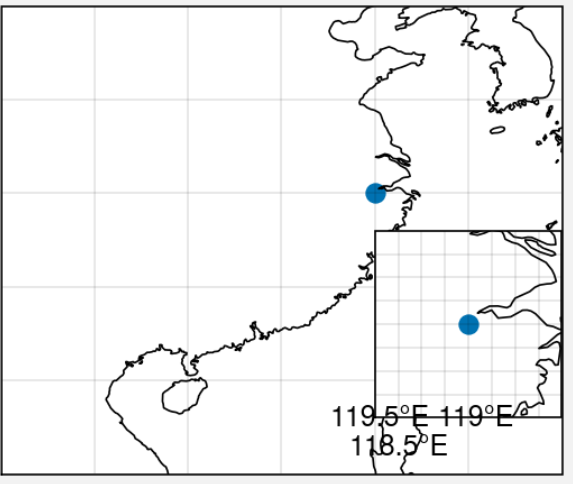
@lukelbd Thanks, here's the example:
import numpy as np
import proplot as pplt
import cartopy.crs as ccrs

pplt.rc.reso = 'med'
fig, axs = pplt.subplots(proj='pcarree')
axs.scatter(120, 30)

bounds = (120, 18, 10, 10)

iax = axs.inset(bounds, proj='pcarree',
                transform=axs.transData,
                zoom=True,
                zoom_kw={'color': 'red3', 'lw': 2, 'ls': '--'}
               )
iax.scatter(120, 30)

iax.format(coast=True, lonlim=(118, 122), latlim=(28, 32), labels=True, dms=False)
axs.format(coast=True, lonlim=(100, 130), latlim=(15, 40))
However, grid labels are wrong and no "zoom in" lines are plotted:
This seems to work pretty well for Plate Carree projections in the latest version. Have to set manually set the left/bottom spaces or else the result is wrong... but not too much effort.
import proplot as pplt
import cartopy.crs as ccrs
pplt.rc.reso = 'med'
fig, axs = pplt.subplots(
    proj='pcarree', coast=True, tight=True, bottom=7, left=1
)
fig.format(lonlim=(0, 180), latlim=(0, 90))
axs.scatter(120, 30)
bounds = (0.8, -0.6, 0.8, 0.8)
iax = axs.inset(bounds, proj='pcarree', zoom=True, zoom_kw={'ec': 'red', 'lw': 2})
iax.format(coast=True, rivers=True, lonlim=(100, 130), latlim=(15, 40))
fig.show()

Non-Plate Carree are a different story thought. Again matplotlib isn't supplying the correct bounds:
import proplot as pplt
import cartopy.crs as ccrs

pplt.rc.reso = 'med'
fig, axs = pplt.subplots(
    proj='robin', coast=True, tight=True, bottom=7, left=1
)
fig.format(lonlim=(0, 180), latlim=(0, 90))
axs.scatter(120, 30)
bounds = (0.8, -0.6, 0.8, 0.8)
iax = axs.inset(bounds, proj='pcarree', zoom=True, zoom_kw={'ec': 'red', 'lw': 2})
iax.format(coast=True, rivers=True, lonlim=(100, 130), latlim=(15, 40))

Since the issue with using the wrong "transform" is fixed I'll remove the "bug" tag.