prometheus
 prometheus copied to clipboard
Remote-Read Performance
What did you do? We have a promethues instance that monitors 3,500 nodes, and provides global queries through the thanos sidecar mode. During use, we found that the query time of the same PromQL in thanos and prometheus differs by 2 times or more. Further monitoring found that /api/v1/read of prometheus has relatively large time delay
What did you expect to see? I would like to be able to improve remote read performance and improve query response time
Environment: System information: Linux 3.10.0-514.el7.x86_64
Prometheus version: prometheus, version 2.33.1 (branch: HEAD, revision: 4e08110891fd5177f9174c4179bc38d789985a13) build user: root@37fc1ebac798 build date: 20220202-15:23:18 go version: go1.17.6 platform: linux/amd64
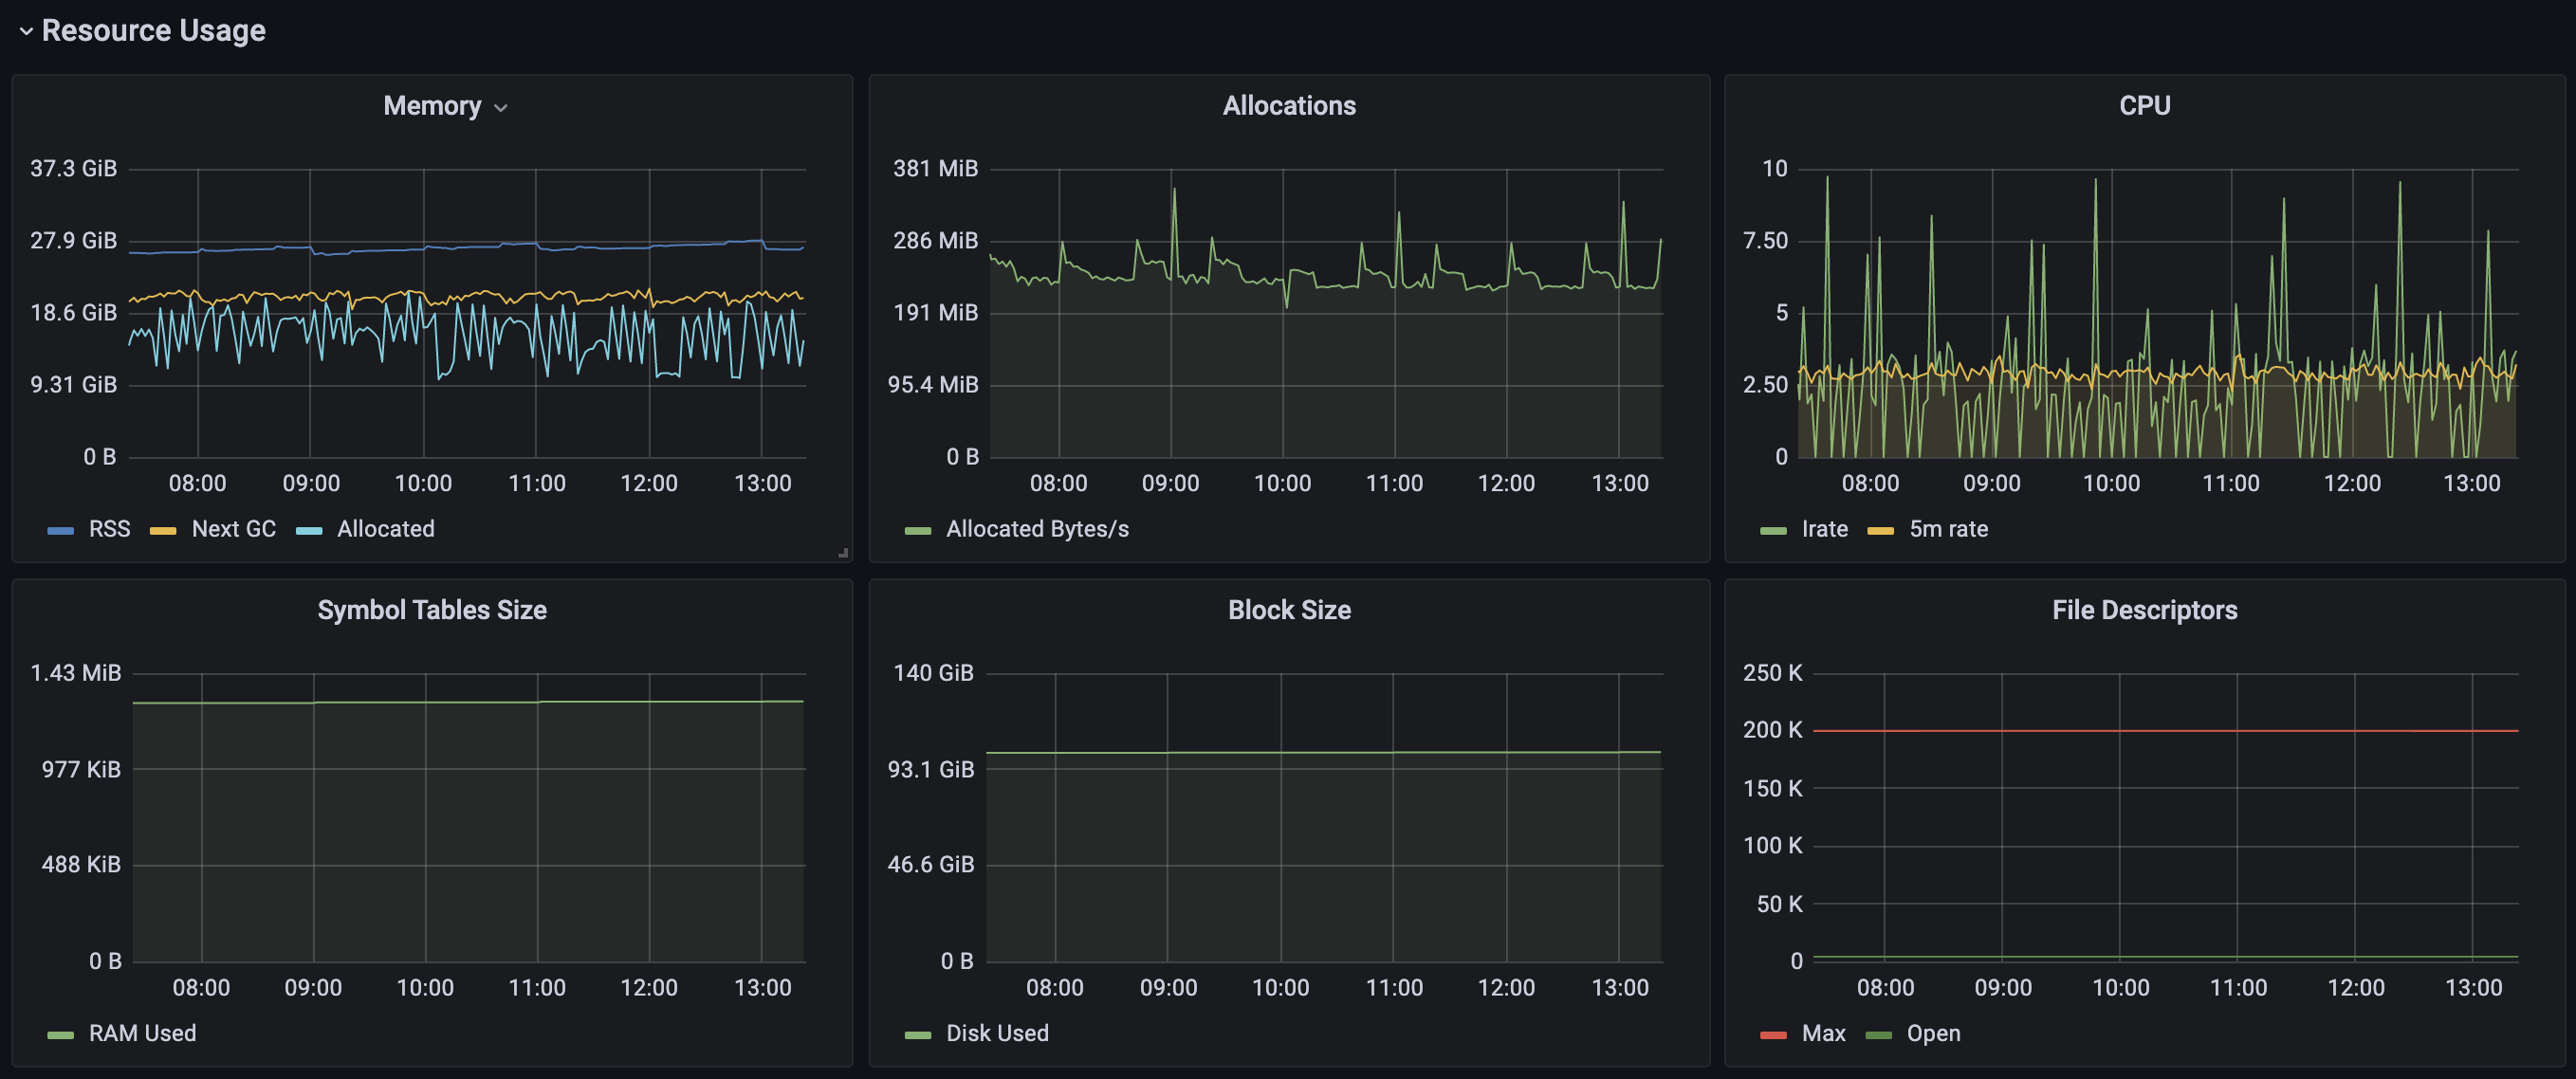
The node has 16 CPUs 64GB memroy 4TB SSD, CPU and Mem usage:
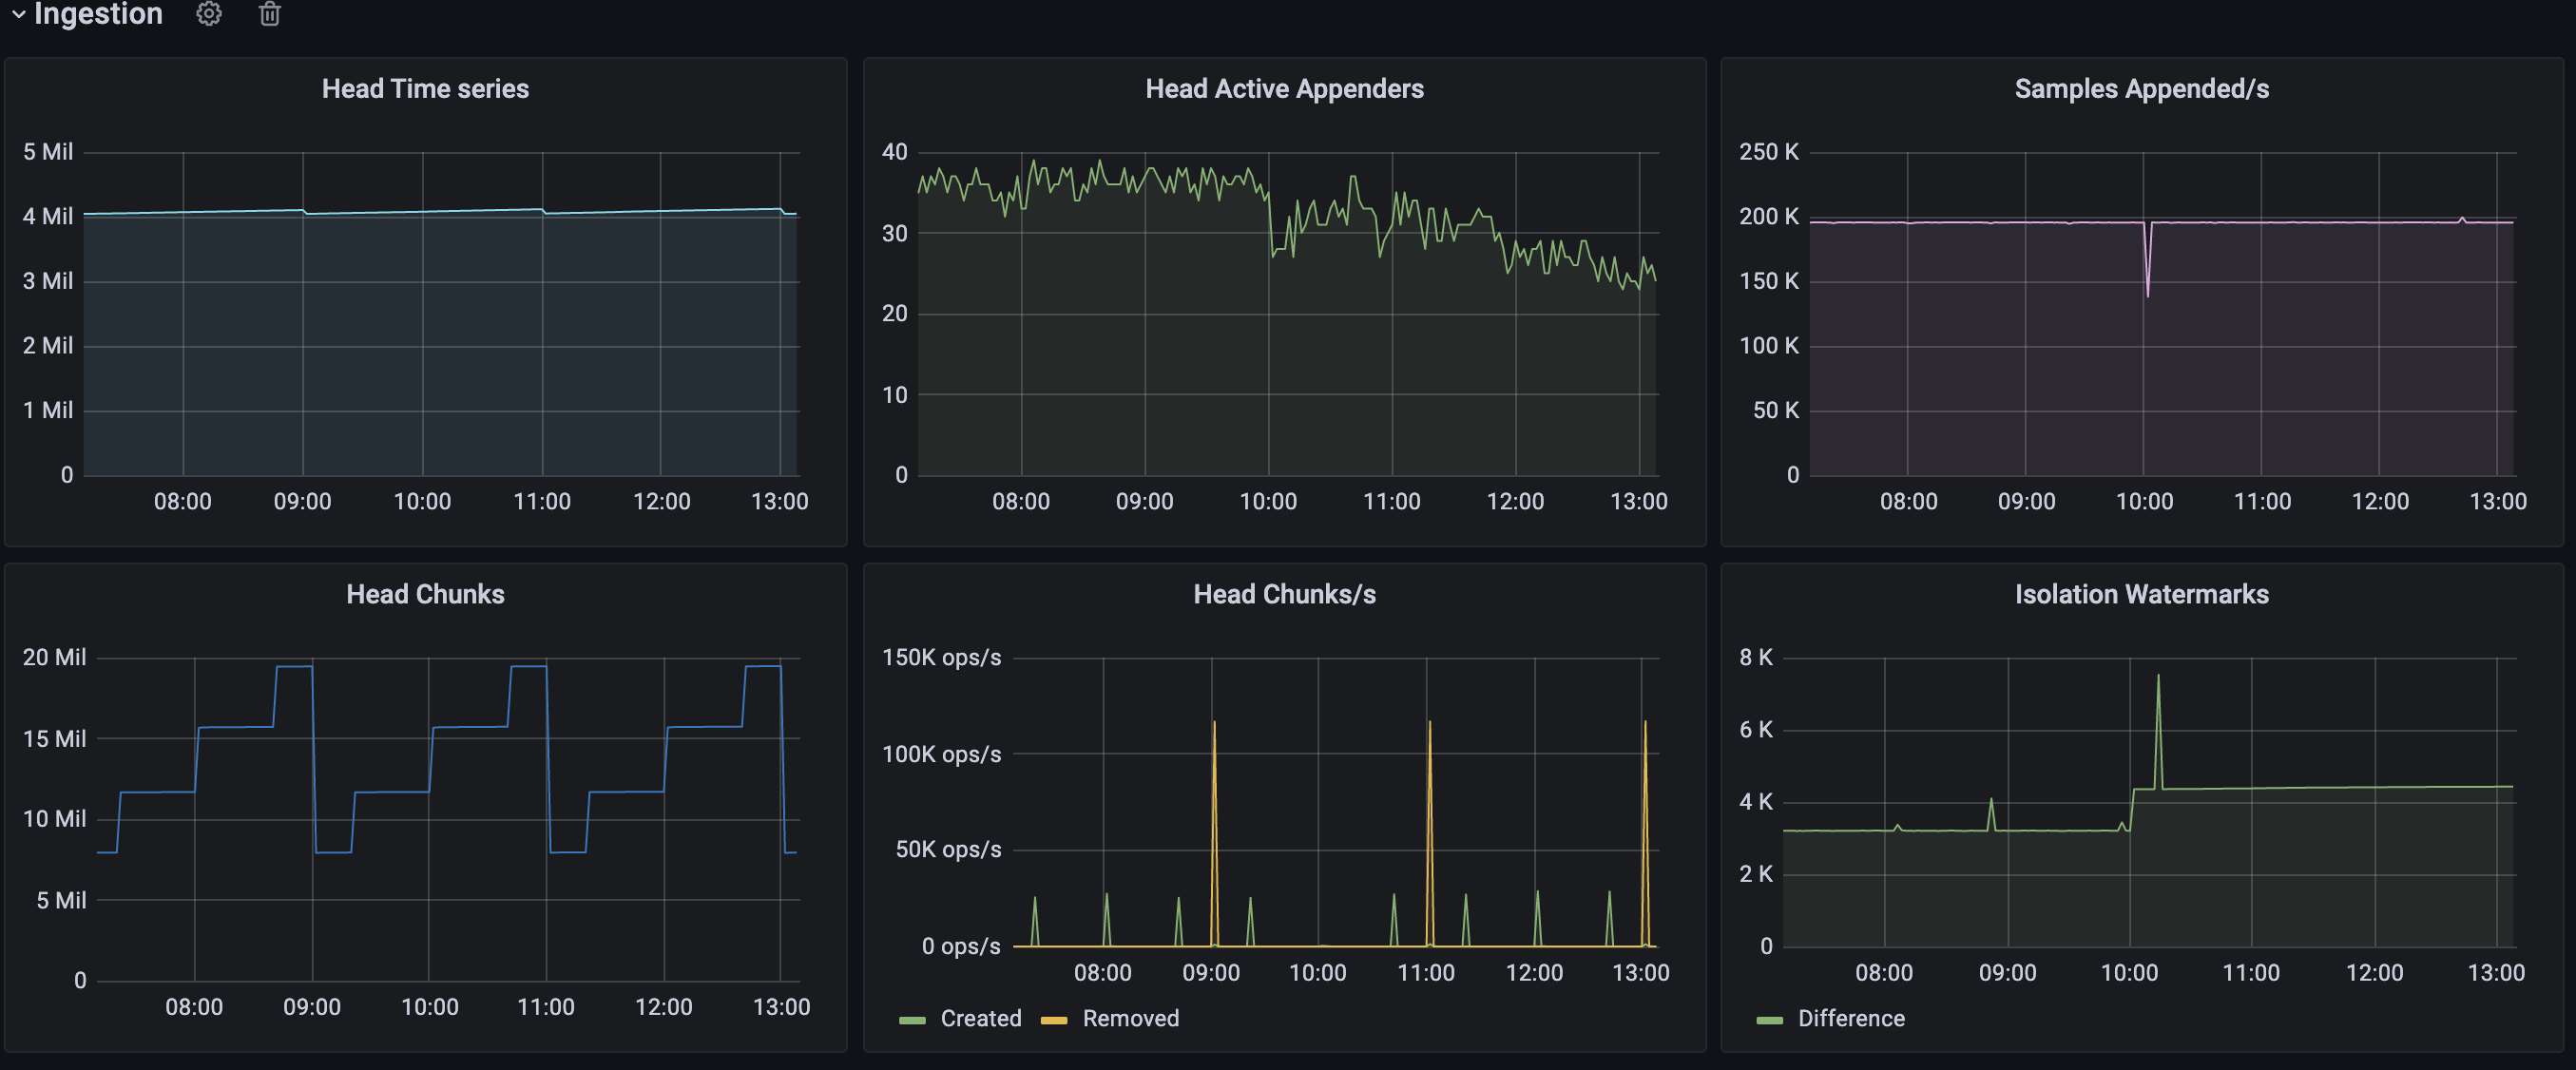
4million series :
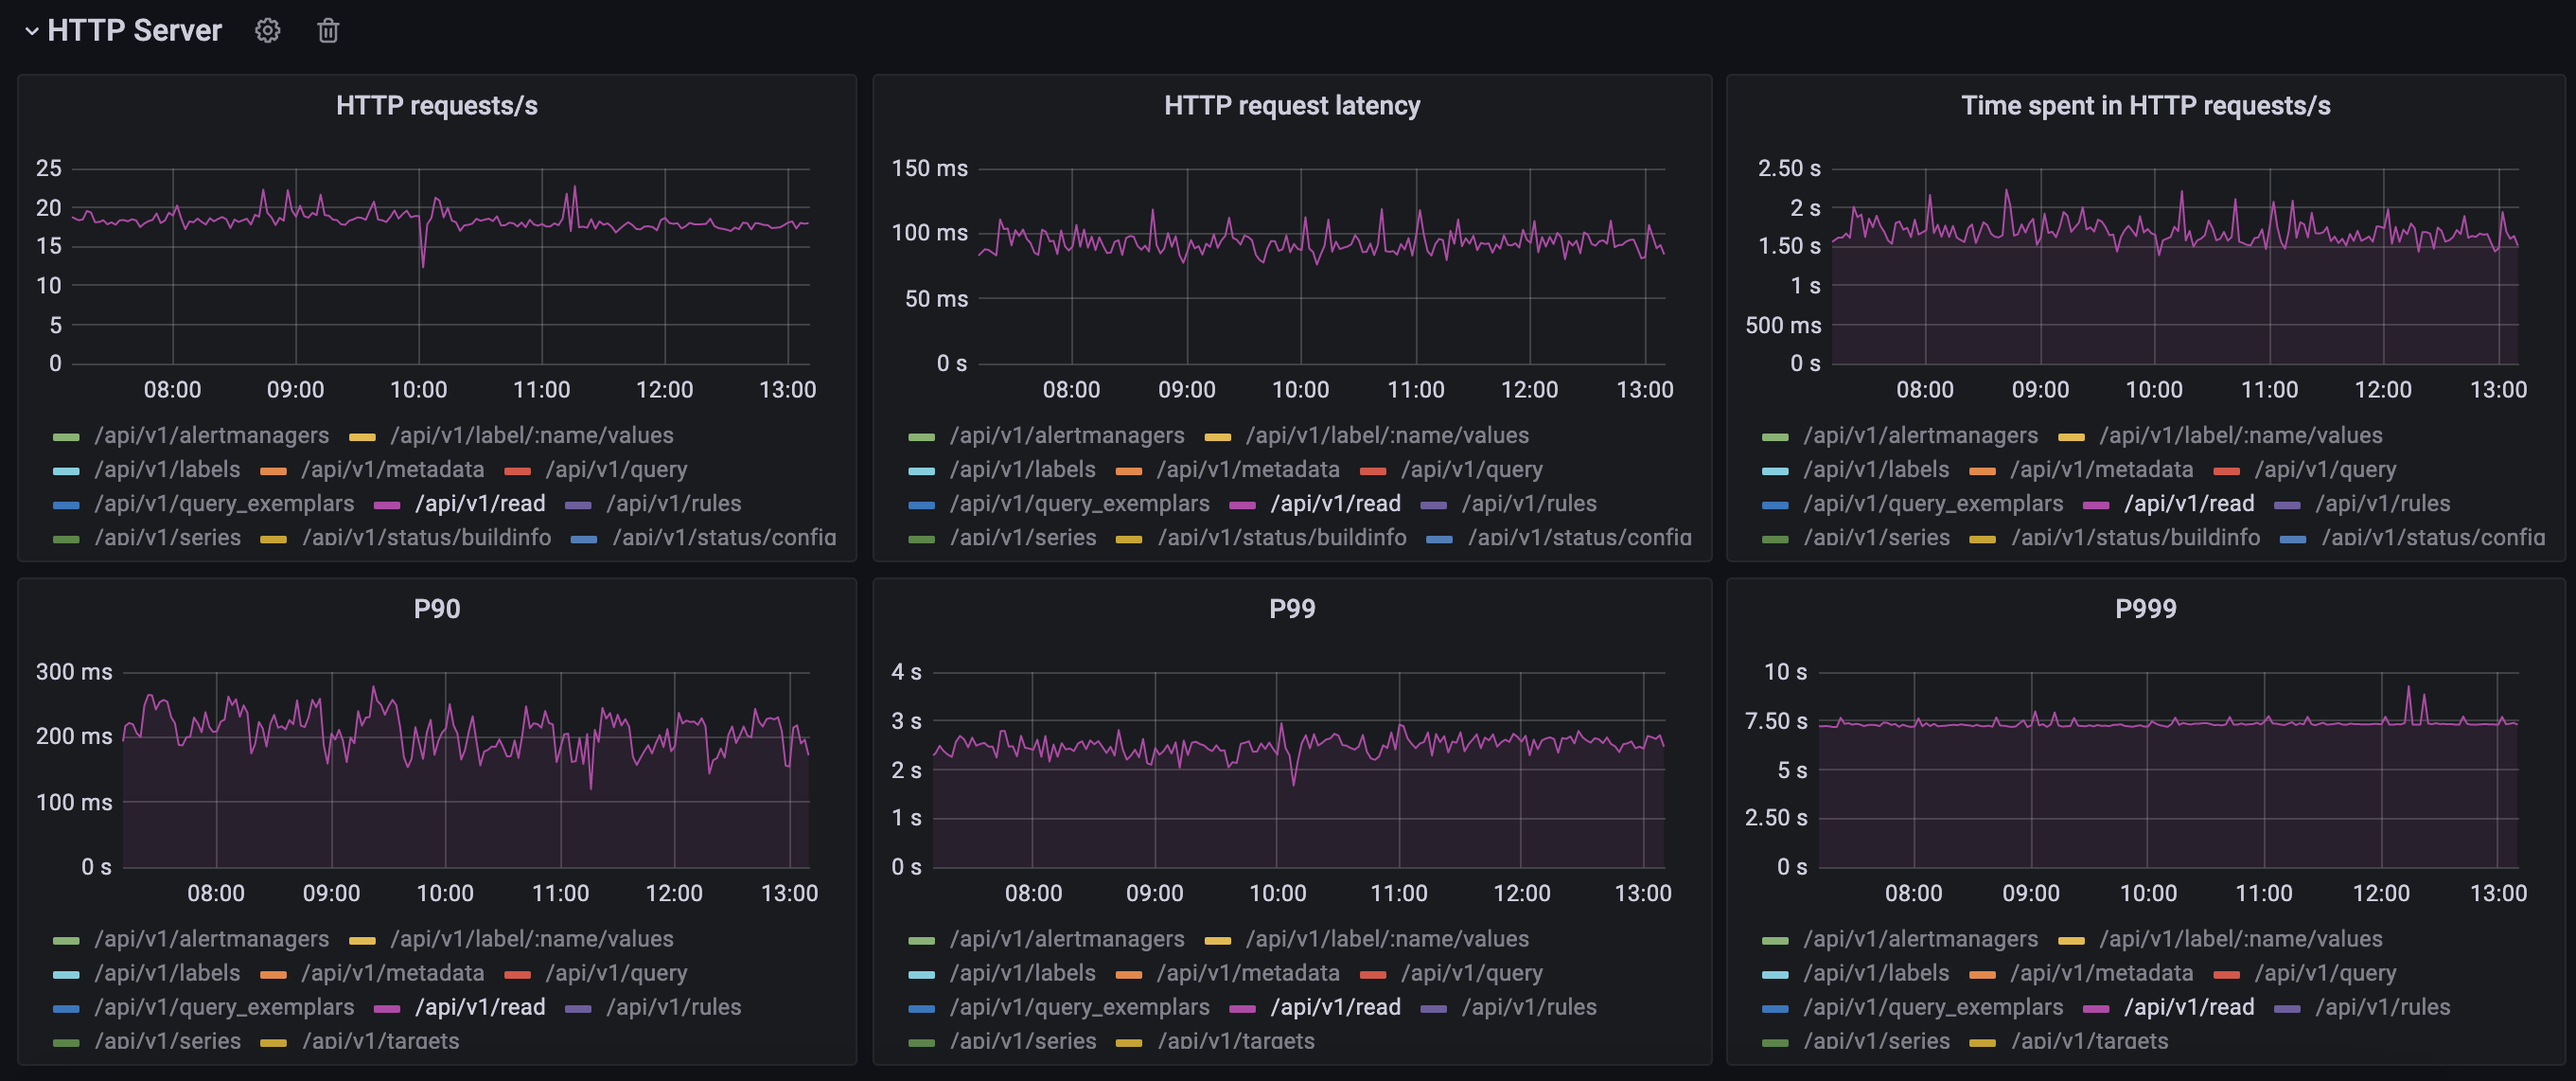
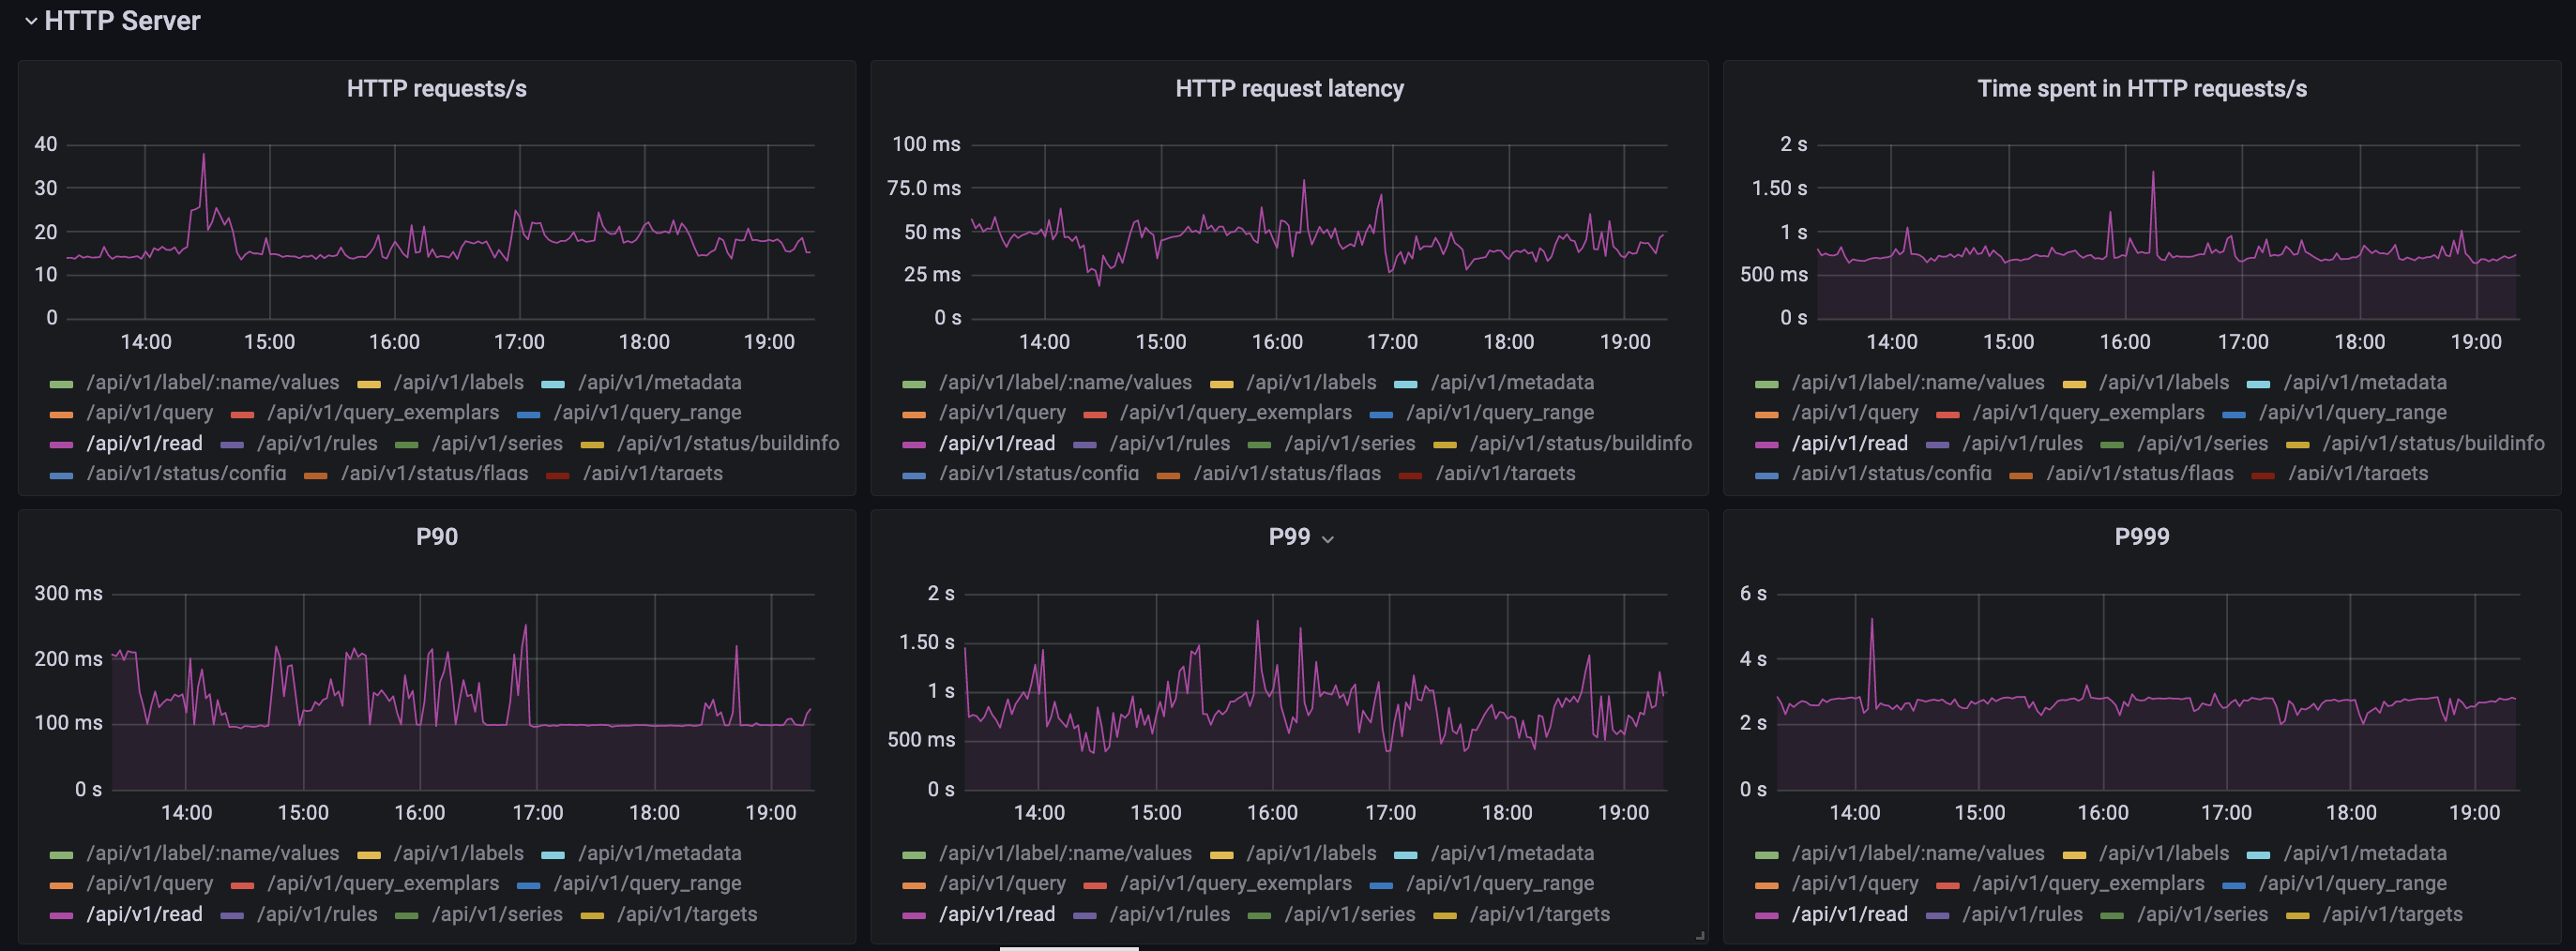
Response time, P99 > 2s:
prometheus pprof profile:
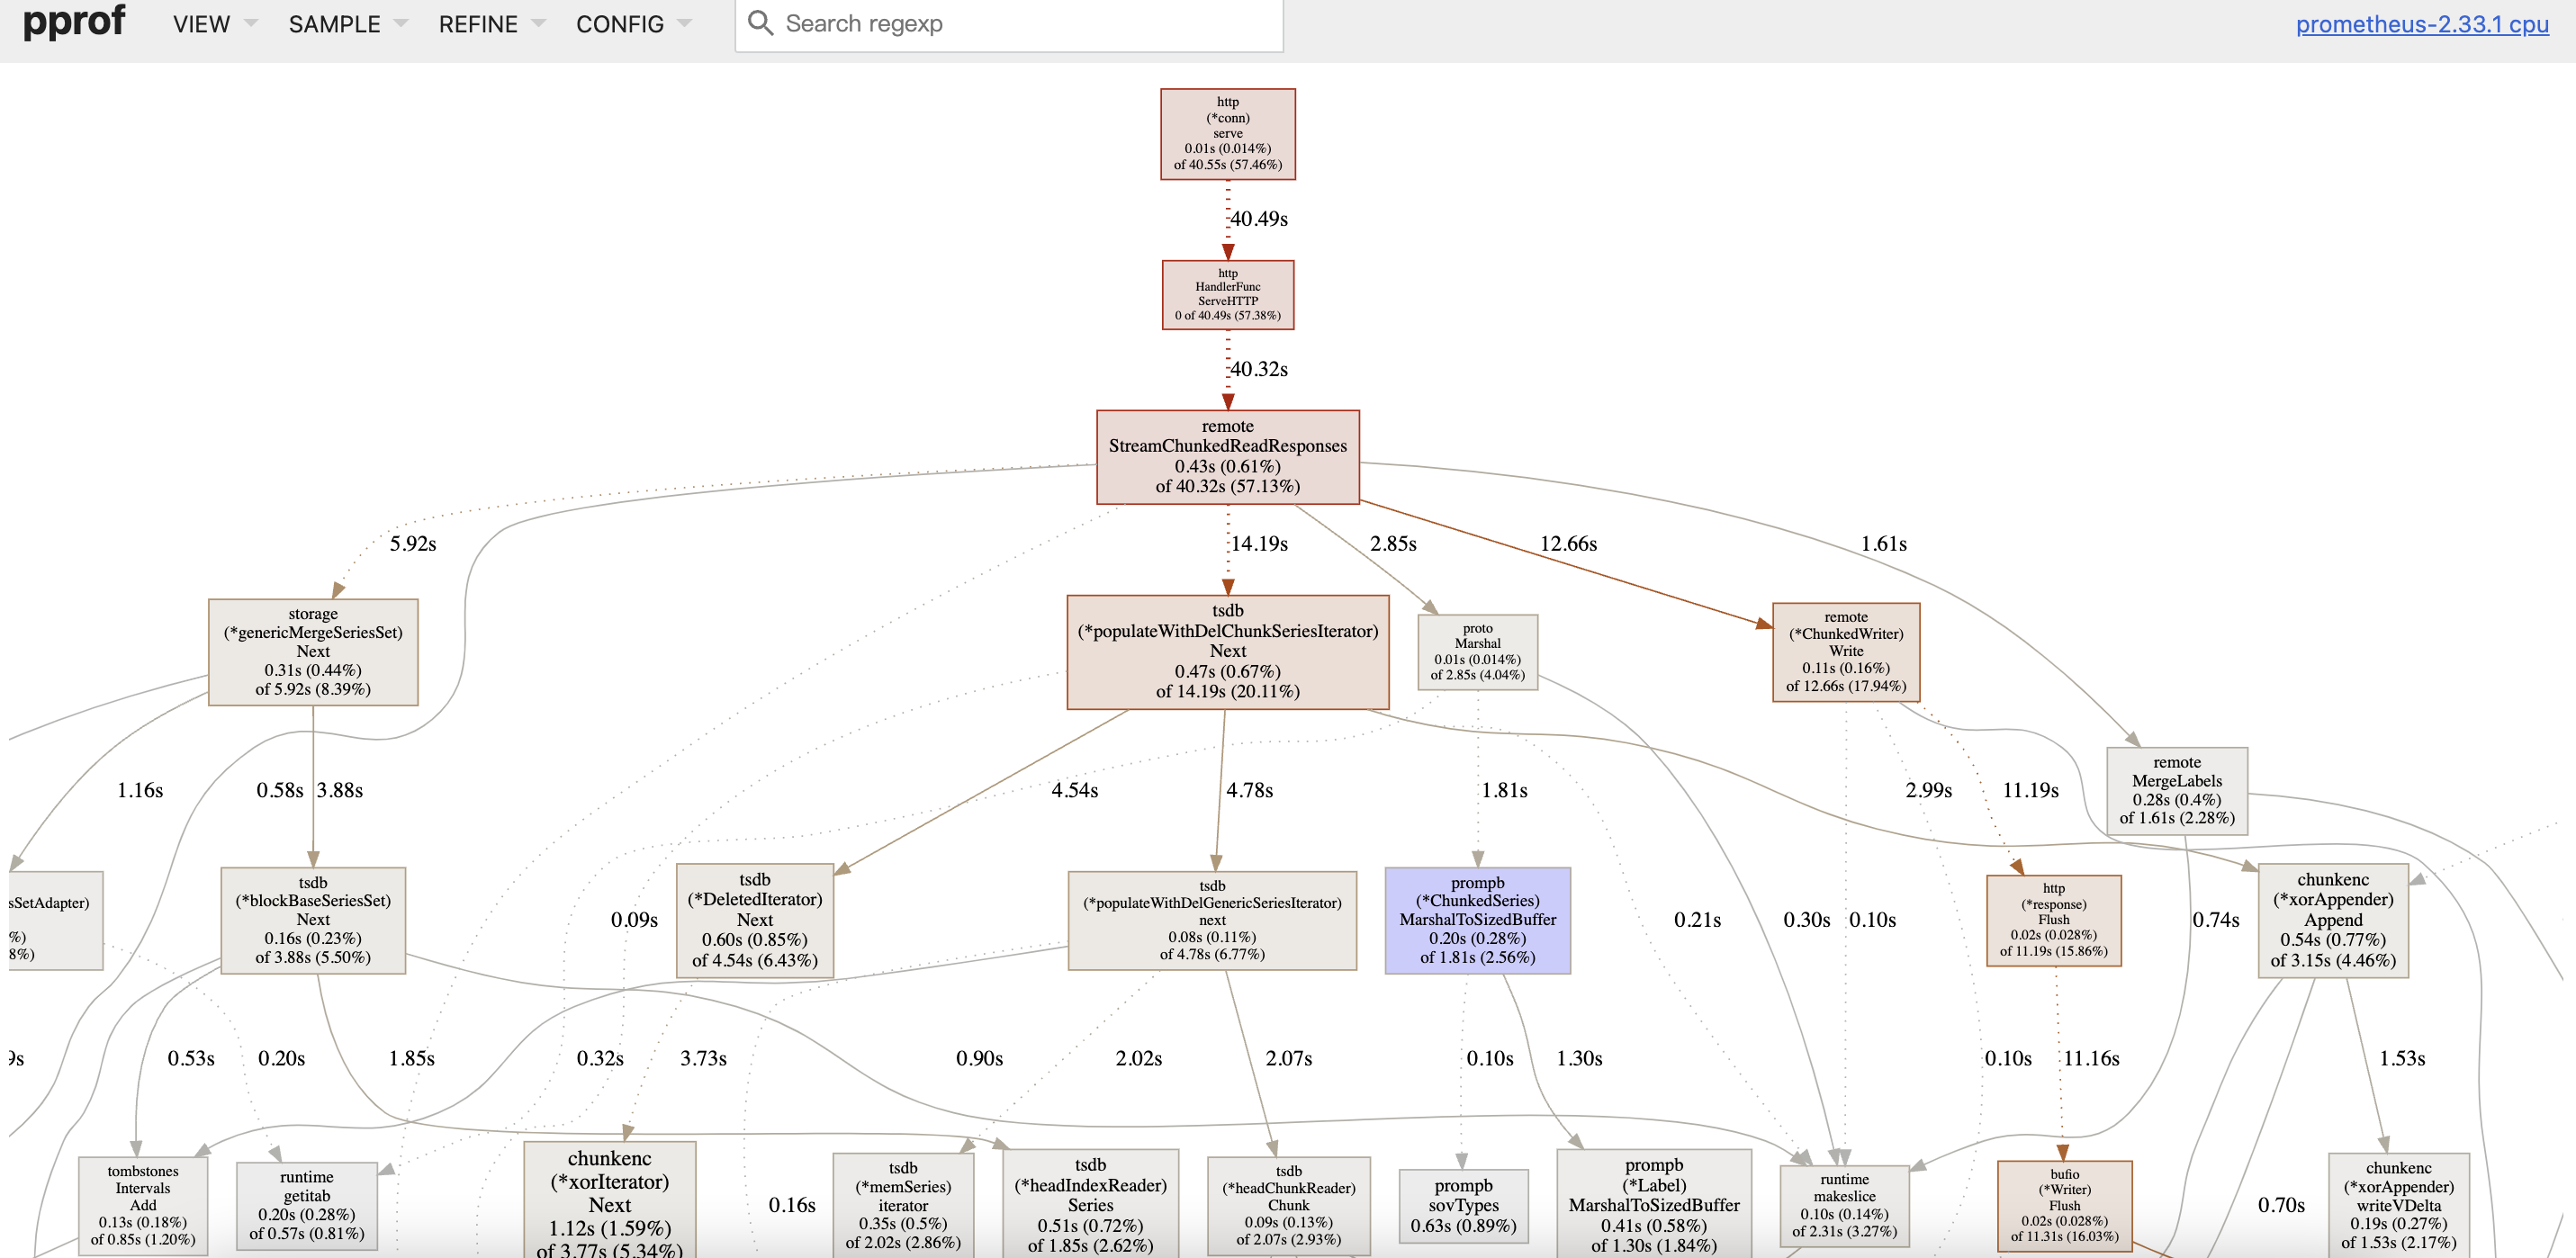
pprof file: prometheus-profile.pprof.zip
Can we get more details into the query and the version of thanos you are comparing to? it is not really a surprise that thanos is doing better.
Thanos version: 0.25.0 I don't know what more information to provide 🙁
Previously all record rules were worked by thanos rule, I estimate that the series queried by several record rules have high cardinality, which is inefficient when going through the /api/v1/read interface, for example: sum (rate(node_cpu_seconds_total{mode!=" idle"}[1m])) without(cpu,mode)
Therefore, I configured some high cardinality record rules in prometheus, then deleted the corresponding rules in thanos rule, and finally deleted some unused labels using relabeling in prometheus.
The adjusted result shows that the P99 latency is reduced by 100%
hello MR.wu,I'm also worried about monitoring Prometheus. Then I see that most of the indicators of Prometheus are provided on your grafana monitoring panel. Can you provide your grafana panel for me to use for reference? be deeply grateful
What did you do? We have a promethues instance that monitors 3,500 nodes, and provides global queries through the thanos sidecar mode. During use, we found that the query time of the same PromQL in thanos and prometheus differs by 2 times or more. Further monitoring found that /api/v1/read of prometheus has relatively large time delay
What did you expect to see? I would like to be able to improve remote read performance and improve query response time
Environment: System information: Linux 3.10.0-514.el7.x86_64
Prometheus version: prometheus, version 2.33.1 (branch: HEAD, revision: 4e08110) build user: root@37fc1ebac798 build date: 20220202-15:23:18 go version: go1.17.6 platform: linux/amd64
The node has 16 CPUs 64GB memroy 4TB SSD, CPU and Mem usage:
4million series :
Response time, P99 > 2s:
prometheus pprof profile:
pprof file: prometheus-profile.pprof.zip
hello MR.wu,I'm also worried about monitoring Prometheus. Then I see that most of the indicators of Prometheus are provided on your grafana monitoring panel. Can you provide your grafana panel for me to use for reference? be deeply grateful