jmx_exporter
 jmx_exporter copied to clipboard
use curl command on server can not get metrics data
Hello,I found a problem on product environment when using jmx prometheus exporter jar file (version 0.11.0)and tomcat.yml or weblogic.yml file to monitor tomcat or weblogic server process , when the process scanned by a security scan tool, the prometheus can not get metrics data, and use curl http://ip:30011/metrics can not get the response data as well. Then I used lsof -i:30011 ,I found that there was 10 more more (example 31) ESTABLISHED connections between security scan tool random port and 30011 port. Is there any bug on jmx exporter? or is the problem of security scan tool?
The underlying HTTP server code uses a fixed thread pool of 5 threads with a backlog of 3... so not sure how you see 10+ ESTABLISHED connections.
Relevant issue:
https://github.com/prometheus/client_java/issues/753
Relevant code:
https://github.com/prometheus/jmx_exporter/blob/ca972bfe693cca03d3a0fac802968e33828a1dd9/jmx_prometheus_javaagent_java6/src/main/java/io/prometheus/jmx/JavaAgent.java#L31
https://github.com/prometheus/client_java/blob/95872fc77cd55f88de9ee377e07fbc4aa2410ff7/simpleclient_httpserver/src/main/java/io/prometheus/client/exporter/HTTPServer.java#L380
https://github.com/prometheus/client_java/blob/95872fc77cd55f88de9ee377e07fbc4aa2410ff7/simpleclient_httpserver/src/main/java/io/prometheus/client/exporter/HTTPServer.java#L437
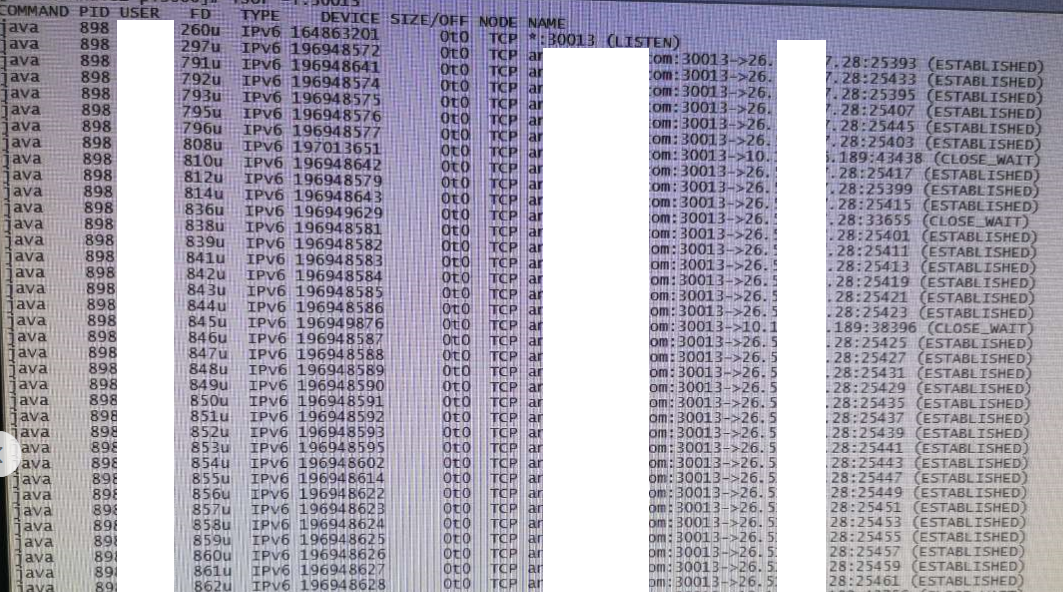 As you can see on this upload image, those ESTABLISHED TCP connections (about 31 connections)between the security scan server 26.5xx.xxx.28 with random port and the application process with port 30013 are what I mentioned above,even security scan tool was shutdown, those TCP connections can not be closed itselfs, unless restart the java process. And the problem occured more than once, wish you can help me to anlyze this odd question. Thanks a lot!
@cnskylee Is the scan tool making a valid HTTP request? I suspect that you will need to set/tune HttpServer properties to force the connections to be cleaned up...
sun.net.httpserver.clockTick Default value = 10000 i.e. 10 sec
sun.net.httpserver.timerMillisDefault value = 1000 i.e. 1 sec
sun.net.httpserver.maxReqTime Default value = -1 i.e. forever. A default > 0 gives timeout = default * (either clockTick ot timerMillis) sec
sun.net.httpserver.maxRspTime Default value = -1 i.e. forever. A default > 0 gives timeout = default * (either clockTick ot timerMillis) sec
Reference: https://stackoverflow.com/questions/15173709/why-does-com-sun-net-httpserver-httpserver-hang
Thank you for your reply. I almost sure that those problem caused by scan tool bugs. But I also has a question that why when scan tool established the connections with be scanned java process, result from this issues that prometheus can not get metrics data from javaagent which run as plugin with those java process ? The java process's port can be telnet successful , and even the web services deploy on that java process can request and responese normal, so TCP connections may not be exhausted.
@cnskylee Is the scan tool making a valid HTTP request? I suspect that you will need to set/tune HttpServer properties to force the connections to be cleaned up...
sun.net.httpserver.clockTickDefault value = 10000 i.e. 10 sec
sun.net.httpserver.timerMillisDefault value = 1000 i.e. 1 sec
sun.net.httpserver.maxReqTimeDefault value = -1 i.e. forever. A default > 0 gives timeout = default * (either clockTick ot timerMillis) sec
sun.net.httpserver.maxRspTimeDefault value = -1 i.e. forever. A default > 0 gives timeout = default * (either clockTick ot timerMillis) secReference: https://stackoverflow.com/questions/15173709/why-does-com-sun-net-httpserver-httpserver-hang
Thank you for your reply. I almost sure that those problem caused by scan tool bugs. But I also has a question that why when scan tool established the connections with be scanned java process, result from this issues that prometheus can not get metrics data from javaagent which run as plugin with those java process ? The java process's port can be telnet successful , and even the web services deploy on it can be requested and responese normal, so the TCP connections may not be exhausted.
The HTTPServer is limited to 5 threads by default. If all 5 threads are busy, you still can create new TCP connections but these connections need to wait for available threads before they can serve HTTP requests.
I agree that this is likely an issue with the scan tool, because usually with Prometheus monitoring you should not have more than 1 request happening at the same time.
Closing as stale. Please reopen if you would like to continue the discussion.