jmx_exporter
 jmx_exporter copied to clipboard
Memory Leak when HEAP_OPTS is not set
Seems that when HEAP_OPTS (MAX MEMORY Option Specifically) is not set, the Prometheus thread crashes sometimes.
Hi @BubbaJoe
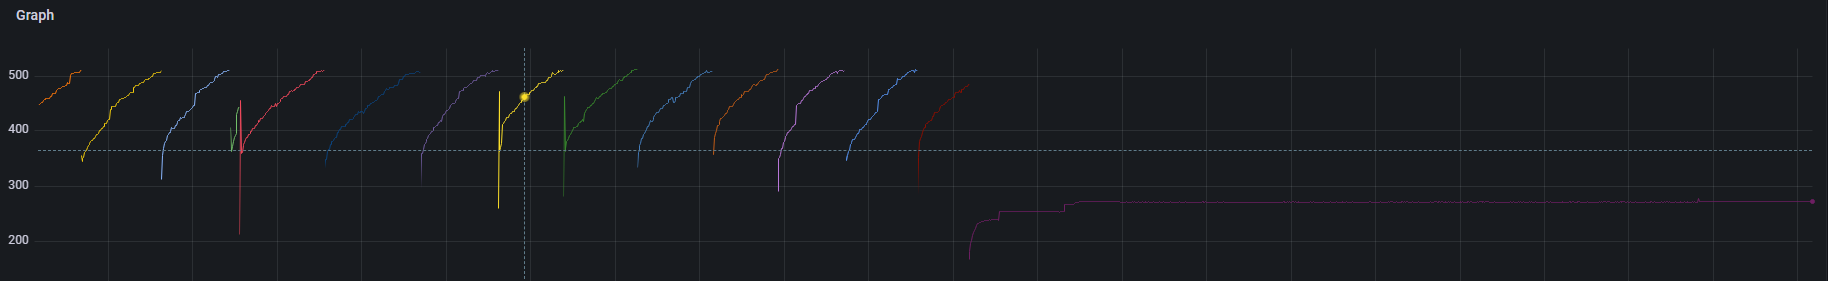
I am running a jmx-exporter in K8S. I think I am finding a memory leak because the memory usage trends to up until the container is killed by K8S and it is restarted.
I have checked both dumps of memory, for live and all objects in memory. I have found there are a lot of not live objects waiting to be deleted.
We will try to set a HEAP_OPTS value.
Just to know, can you elaborate a bit the root cause?
Many thanks
If you say you are running the jmx_exporter, do you mean you attach it as an agent to an existing VM, or are you running it in standalone mode and monitor your application via remote RMI?
If you are using the agent, it would be good to try the standalone mode instead. That way jmx_exporter and the JVM being monitored will be two separate processes, and we could see which process has the memory leak.
In our case we are running the docker image of bitnami jmx-exporter as a sidecar in k8s:
configMap
apiVersion: v1
kind: ConfigMap
data:
  jmx-prometheus.yml: |-
    jmxUrl: service:jmx:rmi:///jndi/rmi://127.0.0.1:5555/jmxrmi
    lowercaseOutputLabelNames: true
    lowercaseOutputName: true
    ssl: false
pod
apiVersion: v1
kind: Pod
spec:
  containers:
  - image: .../jira-software:8.20.8
    name: jira
    ports:
    - containerPort: 5555
      name: jmx
      protocol: TCP
  - command:
    - java
    - -Xmx400m
    - -XshowSettings:vm
    - -jar
    - jmx_prometheus_httpserver.jar
    - "5556"
    - /opt/jmx-config/jmx-prometheus.yml
    image: .../bitnami/jmx-exporter:0
    imagePullPolicy: Always
    name: jmx
    ports:
    - containerPort: 5556
      name: metrics
      protocol: TCP
    resources:
      limits:
        cpu: 150m
        memory: 512Mi
      requests:
        cpu: 150m
        memory: 256Mi
    volumeMounts:
    - mountPath: /opt/jmx-config
      name: jmx-config

@adberger, we had the same situation than you., indeed we found the same memory usage pattern you showed in the picture.
As I mentioned we tried to set the HEAP_OPTS and this fixed the issue.
@adberger, we had the same situation than you., indeed we found the same memory usage pattern you showed in the picture. As I mentioned we tried to set the
HEAP_OPTSand this fixed the issue.
@kiuby88
What do you mean by HEAP_OPTS?
Can you provide some more information?
If you're referring to JAVA_OPTS: We already set Xmx, so MaxRAM for example would get ignored anyway.
This could be an issue with an outdated Java version in bitnami's Docker image.
By default, Java uses 1/4 of the available memory as the maximum heap space. For example, on my laptop with 16G memory a JVM has a max heap space of 4G. You can verify this with java -XX:+PrintFlagsFinal -version | grep MaxHeapSize:
size_t MaxHeapSize = 4116709376 {product} {ergonomic}
Now, let's run Java in a Docker container with 1G memory:
docker run -ti --cpus 1 -m 1G ubuntu
With a current Java verion (I tried the latest OpenJDK 17 release), you will see:
size_t MaxHeapSize = 268435456 {product} {ergonomic}
268435456 Bytes is 256M, so it's exactly 1/4 of the memory available to the Docker container. However, if I try the same with the Java version in bitnami's Dockerfile, I get the following:
uintx MaxHeapSize := 4116709376 {product}
So apparently this Java version is an old version that does not have Docker support, i.e. it does not respect the memory limit in the Docker container. Instead, it grabs 1/4 of the underlying host memory, which is 4G in my case.
To deal with this, you can manually set the max heap size with the -Xmx command line parameter.
I see that there is a -Xmx400m parameter in the Kubernetes deployment you posted above, but I'm not sure how this works in a sidecar. Maybe 400M is too much for your container?
Thanks for the information @fstab
@adberger we have configured the HEAP_OPTS to limit the allocated memory of the heap of the JVM to the memory that the container has.
According to this issues description and the information provide by @fstab, the problem is the exported trends to use more and more memory until the limit of the allocated container's memory is reached, as you can see in the screenshot you posted. When the limit is reached I guess an OoMException is thrown. I think the root cause is the gargabe collector (old generation) is not run because the JVM cannot detect the limit of the available memory. Then, it is needed to say to JVM the available memory.
If I am not wrong I think your container is configured to use 500Mi
Then, you can try to configure your java application using -Xms. As mentioned @fstab I would recommend to use 400M, so you can use -Xmx400M.
Below you can a snippet with an example to configure the exporter in the k8s manifest
        - name: prometheus-jmx-exporter
          image: <image>
          command:
            - java
            - -XX:+UnlockExperimentalVMOptions
            - -XX:+UseCGroupMemoryLimitForHeap
            - -XX:MaxRAMFraction=1
            - -XshowSettings:vm
            - -Xmx400m
            - -jar
            - jmx_prometheus_httpserver.jar
            - <port>
            - <config file>
It seems that setting -Xmx alone doesn't work here, because the container sees over 130GB available which will be used for everything outside of the heap:
ava -Xmx400m -XX:+PrintFlagsFinal -version | grep -iE 'maxram|MaxHeapSize'
uintx MaxHeapSize                              := 419430400                           {product}
uint64_t MaxRAM                                    = 137438953472                        {pd product}
So we set -XX:MaxRAM to the same value as the resource.limits of the container:
java -XX:MaxRAM=500m -XX:+PrintFlagsFinal -version | grep -iE 'maxram|MaxHeapSize'
uintx MaxHeapSize                              := 132120576                           {product}
uint64_t MaxRAM                                   := 524288000                           {pd product}
We are now observing if this solves the issue for now. (We are on cgroups v2)