Blackbox Exporter HTTP probes intermittently failing with i/o timeout
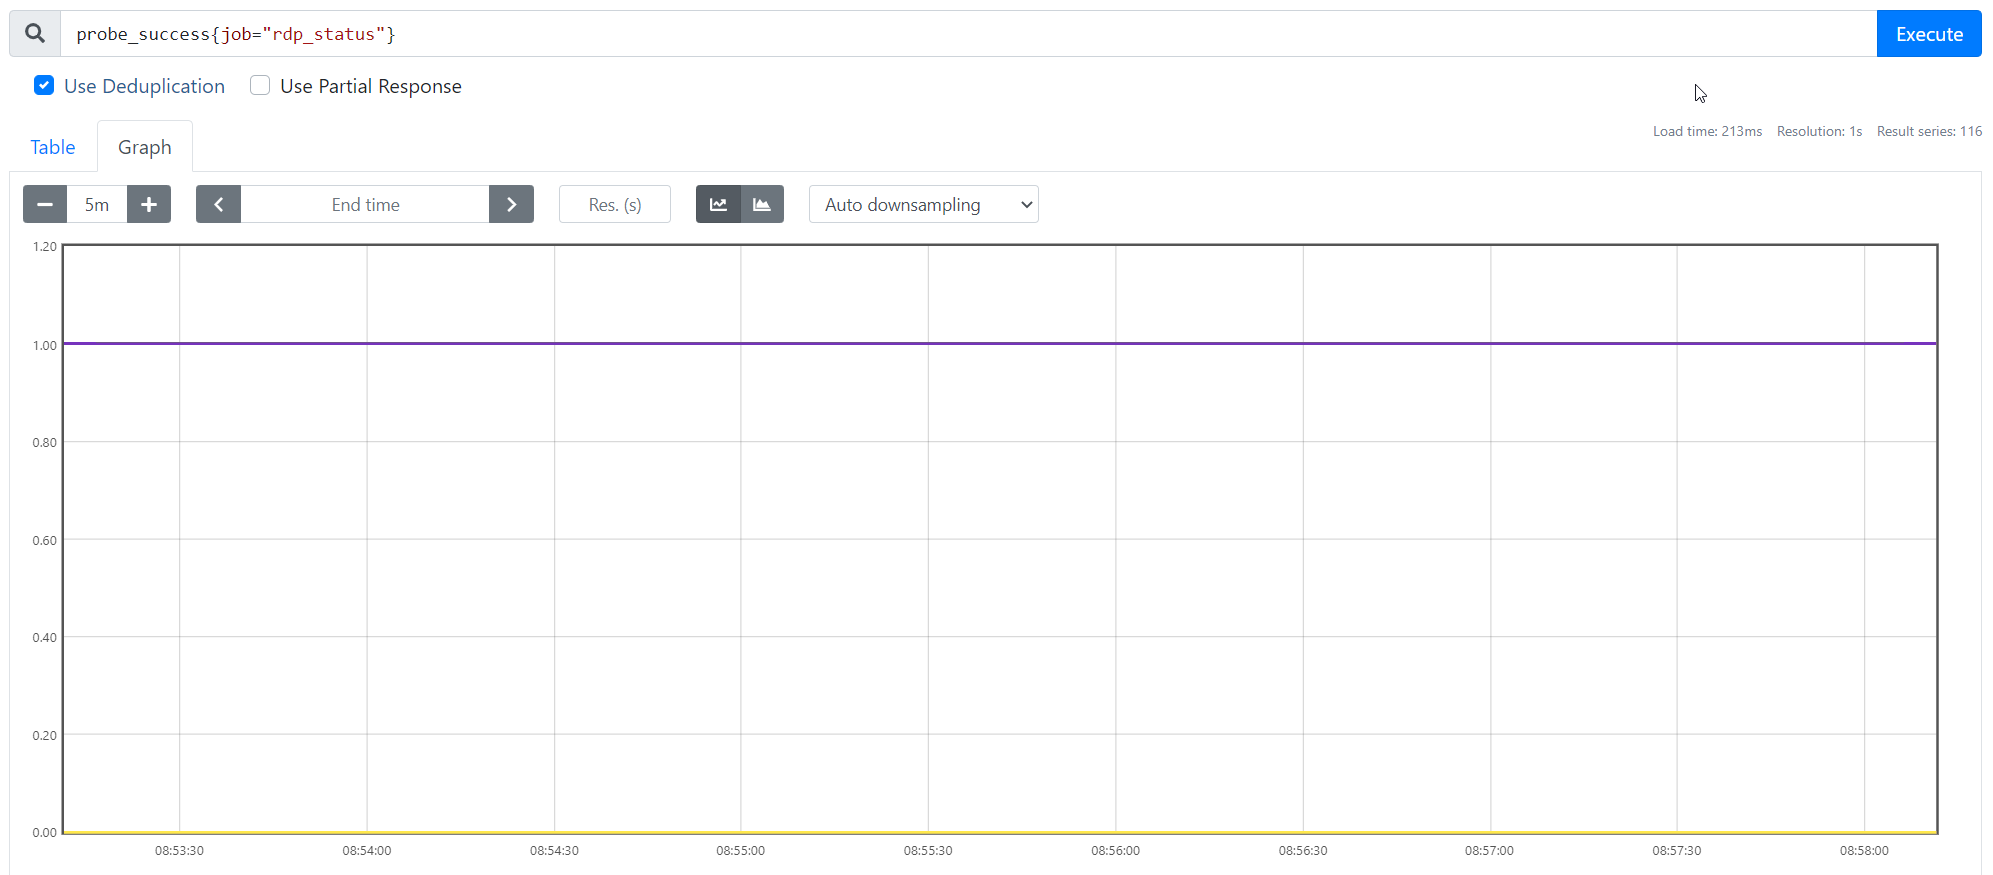
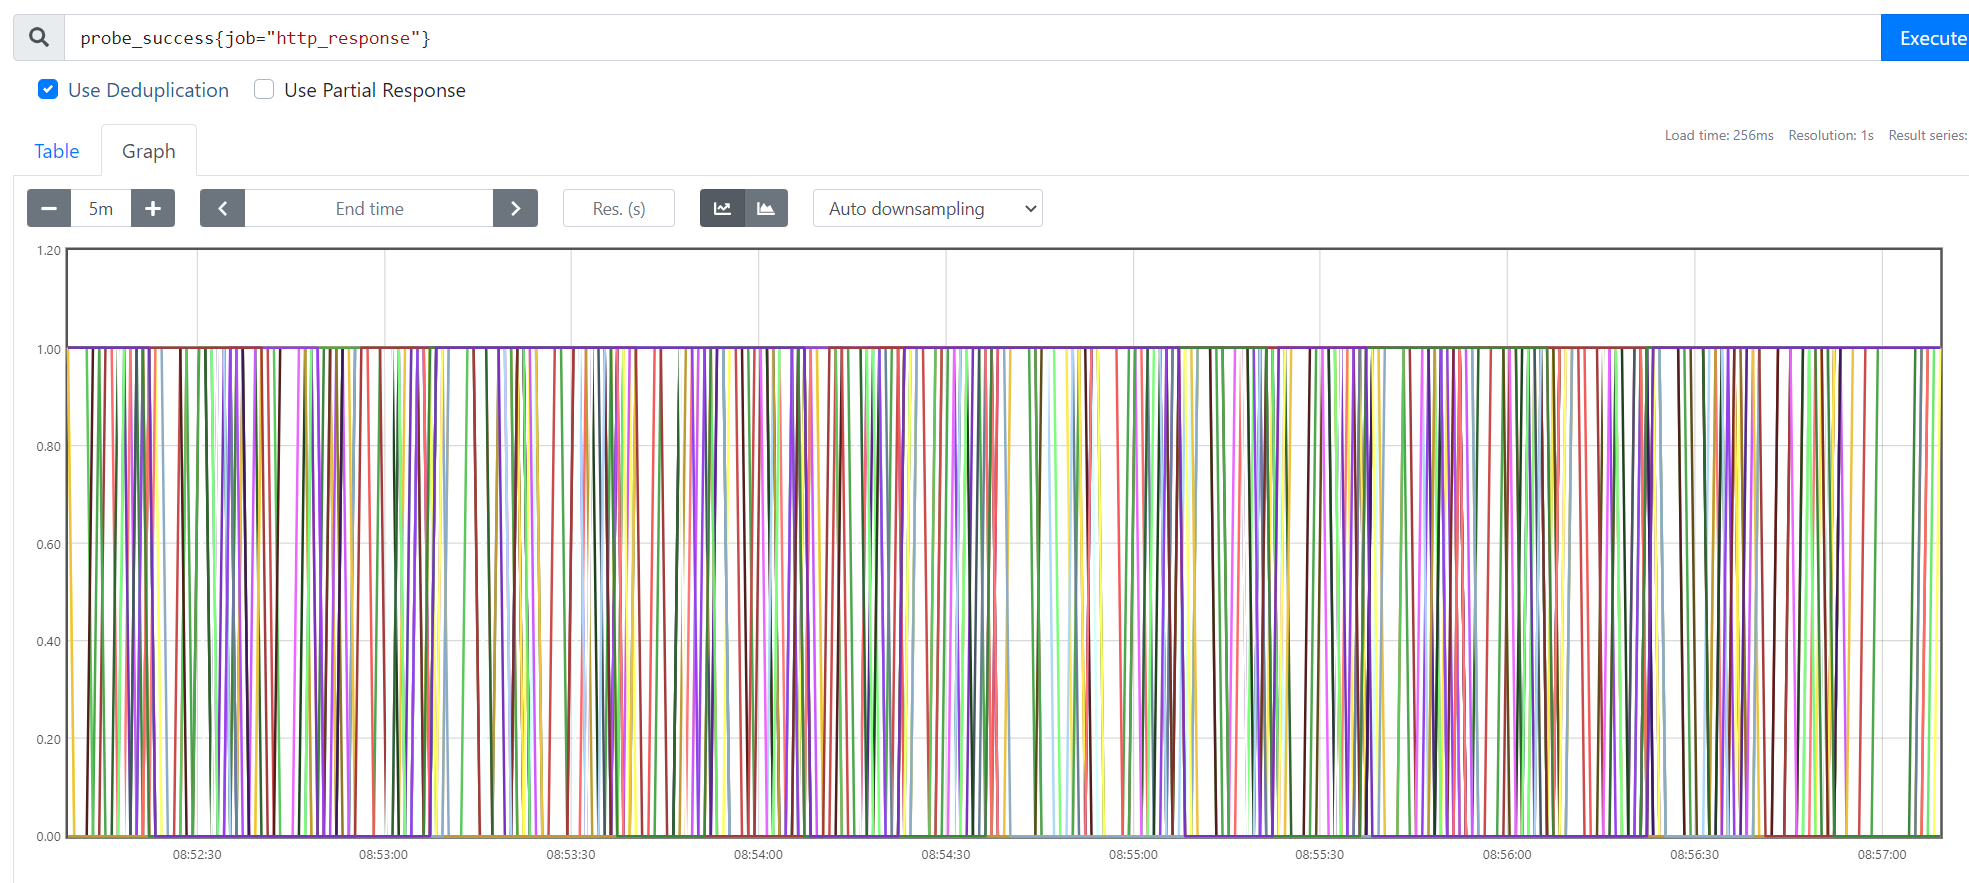
Blackbox Exporter HTTP Probes are flapping between success and fail despite the http endpoint remaining available. Blackbox Exporter and Prometheus are both running as Kubernetes Pods and are not near their imposed CPU or Memory Limits. RDP and SSH probes are working consistently suggesting the problem is solely with the http module.
I am trying to monitor 80 HTTP targets. When reducing this to 50 HTTP works fine which made me believe network sockets may be an issue but 39 SSH targets and 116 RDP targets are working perfectly. In future I would need to monitor ~500 sites.
Host operating system: output of uname -a
Linux blackbox-exporter-755bcf6457-ccr55 5.4.0-1048-azure #50~18.04.1-Ubuntu SMP Fri May 14 15:30:12 UTC 2021 x86_64 GNU
blackbox_exporter version: output of blackbox_exporter --version
0.19.0
What is the blackbox.yml module config.
modules:
  ssh_banner:
    prober: tcp
    tcp:
      query_response:
      - expect: "^SSH-2.0-"
  rdp_banner:
    prober: tcp
  http_2xx:
    prober: http
    timeout: 30s
    http:
      valid_http_versions: ["HTTP/1.1", "HTTP/2.0"]
      valid_status_codes: []  # Defaults to 2xx
      method: GET
      no_follow_redirects: false
      fail_if_ssl: false
      fail_if_not_ssl: false
      tls_config:
        insecure_skip_verify: false
      preferred_ip_protocol: "ip4" # defaults to "ip6"
      ip_protocol_fallback: false  # no fallback to "ip6"
What is the prometheus.yml scrape config.
- job_name: 'http_response'
        metrics_path: /probe
        params:
          module: [http_2xx]
        static_configs:
          - targets:
            - redacted due to client names but a list of 80 sites.
        relabel_configs:
          - source_labels: [__address__]
            target_label: __param_target
          - source_labels: [__param_target]
            target_label: instance
          - target_label: __address__
            replacement: blackbox-service:9115
What logging output did you get from adding &debug=true to the probe URL?
When running the probe manually through the browser I sometimes yet this:
Logs for the probe:
ts=2021-06-28T17:12:40.041451633Z caller=main.go:320 module=http_2xx target=https://clientdomain/applicationstatus.aspx level=info msg="Beginning probe" probe=http timeout_seconds=30
ts=2021-06-28T17:12:40.041632536Z caller=http.go:335 module=http_2xx target=https://clientdomain/applicationstatus.aspx level=info msg="Resolving target address" ip_protocol=ip4
ts=2021-06-28T17:12:40.051796196Z caller=http.go:335 module=http_2xx target=https://clientdomain/applicationstatus.aspx level=info msg="Resolved target address" ip=clientip
ts=2021-06-28T17:12:40.051864897Z caller=client.go:251 module=http_2xx target=https://clientdomain/applicationstatus.aspx level=info msg="Making HTTP request" url=https://clientip/applicationstatus.aspx host=clientdomaindomain
ts=2021-06-28T17:13:10.042333691Z caller=main.go:130 module=http_2xx target=https://clientdomain/applicationstatus.aspx level=error msg="Error for HTTP request" err="Get \"https://clientip/applicationstatus.aspx\": context deadline exceeded"
ts=2021-06-28T17:13:10.042383091Z caller=main.go:130 module=http_2xx target=https://clientdomain/applicationstatus.aspx level=info msg="Response timings for roundtrip" roundtrip=0 start=2021-06-28T17:12:40.051934698Z dnsDone=2021-06-28T17:12:40.051934698Z connectDone=2021-06-28T17:13:10.042352491Z gotConn=0001-01-01T00:00:00Z responseStart=0001-01-01T00:00:00Z tlsStart=0001-01-01T00:00:00Z tlsDone=0001-01-01T00:00:00Z end=0001-01-01T00:00:00Z
ts=2021-06-28T17:13:10.042421592Z caller=main.go:320 module=http_2xx target=https://clientdomain/applicationstatus.aspx level=error msg="Probe failed" duration_seconds=30.000934758
When running through prometheus and clicking the debug logs on the blackbox_exporter homepage, I occasionally see this:
Logs for the probe:
ts=2021-06-29T08:45:42.082603549Z caller=main.go:320 module=http_2xx target=https://clientdomain/applicationstatus.aspx level=info msg="Beginning probe" probe=http timeout_seconds=14.5
ts=2021-06-29T08:45:42.082764451Z caller=http.go:335 module=http_2xx target=https://clientdomain/applicationstatus.aspx level=info msg="Resolving target address" ip_protocol=ip4
ts=2021-06-29T08:45:42.093249576Z caller=http.go:335 module=http_2xx target=https://clientdomain/applicationstatus.aspx level=info msg="Resolved target address" ip=clientip
ts=2021-06-29T08:45:42.093330177Z caller=client.go:251 module=http_2xx target=https://clientdomain/applicationstatus.aspx level=info msg="Making HTTP request" url=https://clientip/applicationstatus.aspx host=clientdomain
ts=2021-06-29T08:45:56.582653148Z caller=main.go:130 module=http_2xx target=https://clientdomain/applicationstatus.aspx level=error msg="Error for HTTP request" err="Get \"https://clientip/applicationstatus.aspx\": dial tcp clientip:443: i/o timeout"
ts=2021-06-29T08:45:56.582692949Z caller=main.go:130 module=http_2xx target=https://clientdomain/applicationstatus.aspx level=info msg="Response timings for roundtrip" roundtrip=0 start=2021-06-29T08:45:42.093386678Z dnsDone=2021-06-29T08:45:42.093386678Z connectDone=2021-06-29T08:45:56.582605248Z gotConn=0001-01-01T00:00:00Z responseStart=0001-01-01T00:00:00Z tlsStart=0001-01-01T00:00:00Z tlsDone=0001-01-01T00:00:00Z end=0001-01-01T00:00:00Z
ts=2021-06-29T08:45:56.582724749Z caller=main.go:320 module=http_2xx target=https://clientdomain/applicationstatus.aspx level=error msg="Probe failed" duration_seconds=14.500084799
What did you do that produced an error?
Keep refreshing
What did you expect to see?
The probe constantly returning a success
What did you see instead?
Alternating probe success
This seems like an environmental problem, I've seen the blackbox_exporter used for hundreds of http sites without issues.
The first thing I would check is process_open_fds / process_max_fds
I've just had a check on this for both prometheus and blackbox exporter and neither are near the max.
To convert to a percentage of max I ran this for Prometheus and got 0.030%:
(process_open_fds{job="prometheus"} / process_max_fds{job="prometheus"})*100
The same for Blackbox exporter and got 0.032%
(process_open_fds{job="blackbox-exporter"} / process_max_fds{job="blackbox-exporter"}) *100
@mortenbirkelund No I didn't. I ended up with the blackbox exporter running on a VM instead at the time.
I think I've stumbled on the exact same issue with the HTTP module probes randomly throwing context deadline exceeded errors.
Something that normally takes a few tens of milliseconds to complete would randomly time out, or at least so it seems.
Based on the probe_duration_seconds metric, some checks get cancelled with context deadline exceeded message according to scrape_timeout's value, resulting probe_success is 0.
First, I tried adjusting scrape_timeout in the scrape_config but it did not improve anything, only made the issue more visible on dashboards.
This took me on a wild goose chase for the next day or two, trying different things for ingress routing, etc. because currently the problem occurs only when targets resolve to AWS NLB's IP addresses. So, AWS EKS (http_2xx probe) -> AWS NLB -> AWS EKS (target endpoint).
Something I have noticed in Blackbox Exporter's probe Debug Logs is that during those failed checks probe_http_duration_seconds metrics phases (processing, connect, etc) were all 0s except for resolve, appearing as if the HTTP probe was not executed even though the hostname resolved.
Logs for the probe:
ts=2023-03-31T17:15:35.392920379Z caller=main.go:181 module=http_2xx target=http://my.example.com/ping level=info msg="Beginning probe" probe=http timeout_seconds=9.5
ts=2023-03-31T17:15:35.393045253Z caller=http.go:327 module=http_2xx target=http://my.example.com/ping level=info msg="Resolving target address" target=my.example.com ip_protocol=ip4
ts=2023-03-31T17:15:35.400950339Z caller=http.go:327 module=http_2xx target=http://my.example.com/ping level=info msg="Resolved target address" target=my.example.com ip=10.10.10.10
ts=2023-03-31T17:15:35.401034744Z caller=client.go:251 module=http_2xx target=http://my.example.com/ping level=info msg="Making HTTP request" url=http://10.10.10.10/ping host=my.example.com
ts=2023-03-31T17:15:44.893938127Z caller=handler.go:117 module=http_2xx target=http://my.example.com/ping level=error msg="Error for HTTP request" err="Get \"http://10.10.10.10/ping\": context deadline exceeded"
ts=2023-03-31T17:15:44.89405342Z caller=handler.go:117 module=http_2xx target=http://my.example.com/ping level=info msg="Response timings for roundtrip" roundtrip=0 start=2023-03-31T17:15:35.401108287Z dnsDone=2023-03-31T17:15:35.401108287Z connectDone=2023-03-31T17:15:44.8939642Z gotConn=0001-01-01T00:00:00Z responseStart=0001-01-01T00:00:00Z tlsStart=0001-01-01T00:00:00Z tlsDone=0001-01-01T00:00:00Z end=0001-01-01T00:00:00Z
ts=2023-03-31T17:15:44.89408467Z caller=main.go:181 module=http_2xx target=http://my.example.com/ping level=error msg="Probe failed" duration_seconds=9.501131013


Metrics that would have been returned:
# HELP probe_dns_lookup_time_seconds Returns the time taken for probe dns lookup in seconds
# TYPE probe_dns_lookup_time_seconds gauge
probe_dns_lookup_time_seconds 0.007920965
# HELP probe_duration_seconds Returns how long the probe took to complete in seconds
# TYPE probe_duration_seconds gauge
probe_duration_seconds 9.501131013
# HELP probe_failed_due_to_regex Indicates if probe failed due to regex
# TYPE probe_failed_due_to_regex gauge
probe_failed_due_to_regex 0
# HELP probe_http_content_length Length of http content response
# TYPE probe_http_content_length gauge
probe_http_content_length 0
# HELP probe_http_duration_seconds Duration of http request by phase, summed over all redirects
# TYPE probe_http_duration_seconds gauge
probe_http_duration_seconds{phase="connect"} 0
probe_http_duration_seconds{phase="processing"} 0
probe_http_duration_seconds{phase="resolve"} 0.007920965
probe_http_duration_seconds{phase="tls"} 0
probe_http_duration_seconds{phase="transfer"} 0
...
My only successful attempt to work around this issue is by adding hostAlias (/etc/hosts file) entries to the Blackbox Exporter's Pod.
hostAliases:
  - ip: 10.10.10.10
    hostNames:
      - my.example.com
This is obviously not ideal, but with this little hack in place, HTTP probe checks magically all complete normally, without timeouts.
Circling back to this, even with hostAliases my checks randomly fail, still.
Hi, I also see the same problem. We did try the suggestion above, but didn't fix it either. Any news on this? Thanks
Hey, I had an issue with the intermittent connections. I found that the connection could NOT be established from the BlackBox exporter logs. I checked out NGINX logs for the same time and found that there are no requests from the BlackBox exporter at this time. Our infra is running on GCP, and I found the packet send errors with ENDPOINT_INDEPENDENCE_CONFLICT and OUT_OF_RESOURCES types in NAT Router metrics. After fixing this, I never see connection timeout issues.
Running into the same issues with blackbox_exporter 0.24, eg context deadline exceeded
Logs for the probe:
ts=2024-04-18T16:54:51.931828646Z caller=main.go:181 module=http_2xx target=https://some.site.local level=info msg="Beginning probe" probe=http timeout_seconds=6
ts=2024-04-18T16:54:51.93211501Z caller=http.go:328 module=http_2xx target=https://some.site.local level=info msg="Resolving target address" target=some.site.local ip_protocol=ip4
ts=2024-04-18T16:54:51.93318443Z caller=http.go:328 module=http_2xx target=https://some.site.local level=info msg="Resolved target address" target=some.site.local ip=XX.XX.XX.XX
ts=2024-04-18T16:54:51.933380522Z caller=client.go:252 module=http_2xx target=https://some.site.local level=info msg="Making HTTP request" url=https://XX.XX.XX.XX host=some.site.local
ts=2024-04-18T16:54:57.932859368Z caller=handler.go:120 module=http_2xx target=https://some.site.local level=error msg="Error for HTTP request" err="Get \"https://\": context deadline exceeded"
ts=2024-04-18T16:54:57.932929576Z caller=handler.go:120 module=http_2xx target=https://some.site.local level=info msg="Response timings for roundtrip" roundtrip=0 start=2024-04-18T18:54:51.933528664+02:00 dnsDone=2024-04-18T18:54:51.933528664+02:00 connectDone=2024-04-18T18:54:51.934102193+02:00 gotConn=0001-01-01T00:00:00Z responseStart=0001-01-01T00:00:00Z tlsStart=2024-04-18T18:54:51.934141869+02:00 tlsDone=0001-01-01T00:00:00Z end=0001-01-01T00:00:00Z
ts=2024-04-18T16:54:57.932969962Z caller=main.go:181 module=http_2xx target=https://some.site.local level=error msg="Probe failed" duration_seconds=6.001080917
My probe success looks bad whereas I know (with a second supervision tool) that there aren't real outages, just blackbox_exporter not being able to communicate with my endpoints.
I've increase blackbox_exporter timeout to 6seconds, set it's process niceness to -18. The exporter is hosted on a VM of which I also increased niceness, but it seems that nothing helps. I've checked host/vm logs and dmesg for any suspicious errors, nothing. Since there's a firewall between my blackbox_exporter VM and the endpoints, I begun checking there for errors too, but there's nothing really obvious. I have about 60K FW sessions, so that shouldn't be the limit. My blackbox_exporter checks about 50 endpoints every 5 seconds, so I suppose TCP limits aren't reached.
Any ideas ?