https://kubernetes.default.svc:443 Unable to Probes monitor issues
kube-prometheus version:0.10.0
How to use probes to monitor k8s apiserver url https://kubernetes.default.svc:443
I customized the https_2xx monitoring type and defined https://kubernetes.default.svc:443 monitoring using Probe, But it doesn't take effect, How can I set up to monitor https://kubernetes.default.svc:443
kubectl -n monitoring get pod | grep blackbox
blackbox-exporter-6798fb5bb4-pbwwt** 3/3 Running 4 2d7h
kubectl -n monitoring edit cm blackbox-exporter-configuration
  "https_2xx":
    "http":
      "method": "GET"
      "tls_config":
        "ca_file": "/var/run/secrets/kubernetes.io/serviceaccount/ca.crt"
      "bearer_token_file": "/var/run/secrets/kubernetes.io/serviceaccount/token"
      "preferred_ip_protocol": "ip4"
    "prober": "http"
cat blackbox-probe-https.yaml
apiVersion: monitoring.coreos.com/v1
kind: Probe
metadata:
  labels:
    app.kubernetes.io/component: exporter
    app.kubernetes.io/name: blackbox-exporter
    app.kubernetes.io/part-of: kube-prometheus
    app.kubernetes.io/version: 0.19.0
  name: blackbox-https
  namespace: monitoring
spec:
  module: https_2xx
  prober:
    url: blackbox-exporter.monitoring.svc:19115
  targets:
    staticConfig:
      static:
      - https://192.168.1.254:6444
      - https://192.168.1.254:6443
      - https://kubernetes.default.svc:443
When you say it doesn't take effect, what do you mean exactly? Is it that you are not seeing the configuration applied, or the target is down etc?
I wasn't able to reproduce and the probe is successful using the following steps:
Add the following snippet to the ConfigMap
      "http_k8s":
        "prober": "http"
        "timeout": "5s"
        "http":
          "bearer_token": "/var/run/secrets/kubernetes.io/serviceaccount/token"
          "tls_config":
            "ca_file": "/var/run/secrets/kubernetes.io/serviceaccount/ca.crt"
Rollout the Deployment:
kubectl -n monitoring rollout restart deployment blackbox-exporter
Add the following Probe
apiVersion: monitoring.coreos.com/v1
kind: Probe
metadata:
  labels:
    app.kubernetes.io/component: exporter
    app.kubernetes.io/name: blackbox-exporter
    app.kubernetes.io/part-of: kube-prometheus
    app.kubernetes.io/version: 0.19.0
  name: blackbox-https
  namespace: monitoring
spec:
  module: http_k8s
  prober:
    url: blackbox-exporter.monitoring.svc:19115
  targets:
    staticConfig:
      static:
      - https://kubernetes.default.svc:443
Observe targets up and successful probe:
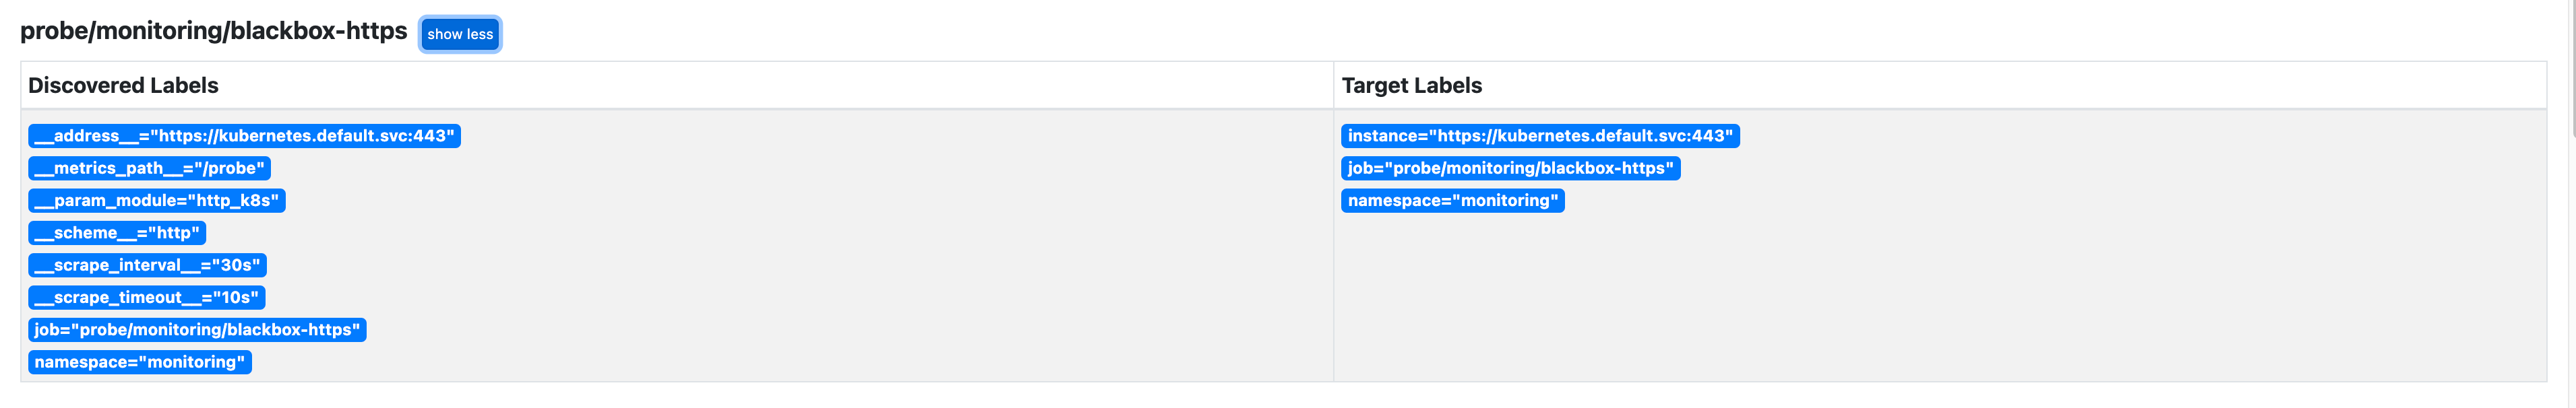

@PhilipGough Thanks,I followed your method and configmap/probe configuration, But the prometheus alert prompts that the website instance https://kubernetes.default.svc:443 cannot be linked,State is FIRING
For specific error information, see picture

Why in the first place you are using blackbox_exporter to probe kubernetes API server? Default kube-prometheus setup already covers monitoring of k8s API.
Why in the first place you are using blackbox_exporter to probe kubernetes API server? Default kube-prometheus setup already covers monitoring of k8s API.
I'mWant to monitor kubernetes API SSL certificate expiration time
This issue has been automatically marked as stale because it has not had any activity in the last 60 days. Thank you for your contributions.
This issue was closed because it has not had any activity in the last 120 days. Please reopen if you feel this is still valid.