Properly understanding CPU utilization metrics
We noticed recently that on a reasonably loaded system (AMD 7702P, 128 hyper threads, 3.35Ghz at low load, will come down to 2.6Ghz as things heat up), there was a large discrepancy in overall and per-hyperthread utilization when comparing taskmgr vs. our windows_exporter metrics + the stuff we pull from WMI independently.
Specifically, taskmgr reported that the average utilization of the system was between 65 and 70%, with many individual cores being completely utilized, with their hyper thread siblings being between 10 and 30% utilized.
Our data from windows_exporter showed that 1 - avg(rate(windows_cpu_time_total{mode='idle'}[2m])) was between 50 and 55%. Our data from the WMI gauge \\Processor(_Total)\\% Processor Time agreed with windows_exporter.
The data for individual hyperthreads showed two bands, one between 70 and 85% utilization and the other between 20 and 50%.
We updated our independently gathered metrics to use \\Processor Information(_Total)\\% Processor Utility and this seemed to line up with what taskmgr was providing for overall utilization. % Processor Time is seemingly very old and doesn’t handle variance in CPU frequency.
If we trust taskmgr, with windows_exporter / perflib, we have a 10-15% difference in overall system utilization at higher load as our CPU clocks down, and the per core utilization is being misallocated across each pair of hyperthreads.
This brings me to my questions:
- Has anyone else observed this? It seems to happen on all of the various CPU types we have.
- Even though it’s a gauge, would a PR which exposed ProcessorUtilityRate be accepted, since it seems to offer us something that IdleTimeSeconds does not?
- What does processor_performance actually represent? I had hoped that it would help me scale idle time to show some kind of “performance lost to frequency or IPC decrease”, but all I can say for sure is that its rate is close to 0 when a system is idle, and close to 80M $somethings per second on a very busy hyperthread. The maximum seems to be around this number regardless of base CPU frequency.
There's been a number of reports of the data not lining up, but noone has done such a thorough investigation. Thanks for that!
So, first off, on Win2008R2+, we actually use \\Processor Information(*)\* counters, rather than \\Processor(*), but I recall the overall data being similar.
Interestingly, we seem to added ProcessorUtilityRate so we extract the data, but don't expose an actual metric:
https://github.com/prometheus-community/windows_exporter/blob/74eac8f29b8083b9e6a4832d739748739e4e3fe0/collector/cpu.go#L261
It'd be interesting to see how that data looks, it might be a counter internally (it often is), so if you have time to have a look at that it'd be great!
Re processor_performance, I tried deciphering it a few years ago, but didn't really figure it out, sadly :(
I think we might have answered part of the processor_performance question....
If you do something like this:
windows_cpu_core_frequency_mhz{}
* (rate(windows_cpu_processor_performance{}[2m]))
/ ON (core) (1 - sum by (core) (rate(windows_cpu_cstate_seconds_total{}[2m])))
/ (scalar(count(windows_cpu_core_frequency_mhz{}) / 2))
On an AMD system, you will get a nice graph showing the effective P-state frequency of each hyperthread; if you're familiar with turbostat on Linux, it looks a lot like the Bzy_MHz column. If you remove the cstate_seconds bit, you'll get the equivalent of the Avg_MHz. This lines up pretty well with what I got from AMD's profiling tools.
On Intel systems, you need to replace that 2 denominator with a 0.5 for it to make sense. Without knowing where the metric comes from, it's hard to speculate as to why this is the case. I'm still pretty sure that Windows doesn't provide any known interface into the APERF / MPERF MSRs, but I have no idea where else it could come from.
About the idle metrics...
I've found that:
avg (sum by (core) (rate(windows_cpu_cstate_seconds_total{}[2m]))) (total time spent in c-states)
and
avg(rate(windows_cpu_time_total{mode='idle'}[2m]))
differ by 5-15% depending on load.
I would trust the former to be more reliable, and is closer to the % processor utility number.
So, our graph of CPU utilisation is made up of the following (BYO labels & $__interval):
- Kernel time that isn't DPC / softirq:
avg (rate(windows_cpu_time_total{mode='privileged'}[2m]) - ON (core) rate(windows_cpu_time_total{mode='dpc'}[2m]))
- DPC / Interrupt / User:
avg by (mode) (rate(windows_cpu_time_total{mode!~'(idle|privileged)'}[2m]))
- Idle:
avg (sum by (core) (rate(windows_cpu_cstate_seconds_total{}[2m])))
If you use the "old" Idle metric, it very neatly adds up to 100%, but I have little faith in it.
I'll investigate the utility metric next week if time permits.
Thanks to @tycho for his help in getting it this far.
Hi @carlpett,
Sorry for the huge delay in following up on this - it's been a busy year.
I revisited this issue recently because some BIOS tuning failed to apply on a subset of servers, and it would have been really useful to have an alert to flag that a server wasn't going into boost properly.
Here's what I've found:
As it stands, the windows_cpu_processor_performance is effectively meaningless. Here's some powershell to demonstrate why:
Get-Counter -Counter "\Processor Information(0,1)\% Processor Performance"

Timestamp                  CounterSamples
---------                  --------------
8/12/2022 11:06:13 AM      \\blahblah\processor information(0,1)\% processor performance :
                           205.295719844358
which makes sense since it's a 2.0GHz CPU which boosts to about 4.3GHz.
When we dig into the counter a bit more like this:
(Get-Counter -Counter "\Processor Information(0,1)\% Processor Performance").CounterSamples | select *

Path             : \\blabblah\processor information(0,1)\% processor performance
InstanceName     : 0,1
CookedValue      : 214.033829499323
RawValue         : 44662434713
SecondValue      : 218918308
MultipleCount    : 1
CounterType      : AverageCount64
Timestamp        : 8/12/2022 11:20:32 AM
Timestamp100NSec : 133047768329218584
Status           : 0
DefaultScale     : 0
TimeBase         : 10000000
The RawValue is what the exporter metric uses, but the AverageCount64 type is described in https://docs.microsoft.com/en-us/dotnet/api/system.diagnostics.performancecountertype?view=dotnet-plat-ext-6.0 as being:
An average counter that shows how many items are processed, on average, during an operation. Counters of this type display a ratio of the items processed to the number of operations completed. The ratio is calculated by comparing the number of items processed during the last interval to the number of operations completed during the last interval. Counters of this type include PhysicalDisk\ Avg. Disk Bytes/Transfer.
If you take RawValue / SecondValue, it (roughly...) returns the CookedValue, which would be very useful to have.
I dug around perflib_exporter/perflib/perflib.go and it looks like any of the AverageCount types have unused 8 bytes after them that seem to line up with the SecondValue field, which is expected to be a UInt64
@@ -450,6 +449,15 @@ func convertCounterValue(counterDef *perfCounterDefinition, buffer []byte, value
                value = int64(bo.Uint32(buffer[valueOffset:(valueOffset + 4)]))
        }

+       switch counterDef.CounterType {
+       case 1073874176:
+               secondsOffset := valueOffset + int64(counterDef.CounterSize)
+               seconds := int64(bo.Uint64(buffer[secondsOffset:(secondsOffset + 8)]))
+               if seconds != 0 {
+                       value = value / seconds
+               }
+       }
+
And we get something that is good enough, but still not exactly the same as the cooked value.
windows_cpu_processor_performance{core="0,0"} 201
windows_cpu_processor_performance{core="0,1"} 197
windows_cpu_processor_performance{core="0,10"} 196
windows_cpu_processor_performance{core="0,11"} 193
windows_cpu_processor_performance{core="0,12"} 195
windows_cpu_processor_performance{core="0,13"} 192
windows_cpu_processor_performance{core="0,14"} 193
windows_cpu_processor_performance{core="0,15"} 192
windows_cpu_processor_performance{core="0,2"} 201
windows_cpu_processor_performance{core="0,3"} 195
windows_cpu_processor_performance{core="0,4"} 193
windows_cpu_processor_performance{core="0,5"} 196
windows_cpu_processor_performance{core="0,6"} 196
windows_cpu_processor_performance{core="0,7"} 196
windows_cpu_processor_performance{core="0,8"} 195
windows_cpu_processor_performance{core="0,9"} 196
I'm not familiar enough with the perflib code (and my golang has atrophied a bit) to know if my approach is safe; perhaps @leoluk has some input on this.
This would also enable the addition of an accurate processor utility gauge.
Of course, I start testing this on some actually loaded production systems and the got complete nonsense back. I investigated some more, and I'm pretty sure that RawValue is an approximation of the APERF MSR and SecondValue is the MPERF MSR.
We know that real_freq = tsc_freq * (aperf_t1 - aperf_t0) / (mperf_t1 - mperf_t0). To test, in perflib.go, for any of the AverageCounter64 metrics, I created a second fake PerfCounter with "_SecondValue" appended to it and plumbed that through to a new metric windows_cpu_processor_mperf, and it works really well.
I'll let it bake for a few more days, but if this is useful for people other than me, it'll require changes in both this project and perflib-exporter.
Thanks @higels, I appreciate the time you've spent looking into this one :+1:
If you need any assistance making changes just let me know.
Hi @breed808 - I've made a rough version of the proposed changes here:
https://github.com/prometheus-community/windows_exporter/compare/master...higels:windows_exporter:add_mperf_metric
and to perflib_exporter here:
https://github.com/leoluk/perflib_exporter/compare/master...higels:perflib_exporter:add_secondvalue_plumbing
Basic summary is that we add a SecondValue member to perflib.PerfCounter, populate it where appropriate and then allow a secondvalue flag (or whatever it's called) to signal to the unmarshaller that we should use that instead of the RawValue. I think this facilitates fairly convenient reuse down the line. A colleague recommended I just follow the pattern that json uses with omitempty.
I haven't tested this much yet, but just wanted to make sure I was on the right track.
I still need to improve the metric descriptions, but that's the easy part.
I have a few more questions:
- I assume we/you would need to update the project to use a later release of perflib_exporter, if / when my changes there were accepted - is that likely to happen?
- I'm not really sure what to do with scaling of
ProcessorMPerf- I don't like that it and ProcessorPerformance are tightly related metrics, but the former needs to be scaled up by 1e4 for it to be usable. -
% Processor Utilityis also a really interesting metric and gives an accurate CPU idle % that lines up with taskmgr - would you prefer that in a later merge request, or ok to add now?
I've been running an exporter based on my changes above for a day now on quite a large number of systems, and I have CPU metrics that very accurately match what taskmgr shows. I do a bit of creative promql to break out Privileged Utility Time into system, dpc and interrupt and everything adds up to 100%. It's a little concerning how different the results are.
windows_cpu_time_total based metrics on the left, my newer metrics on the right:
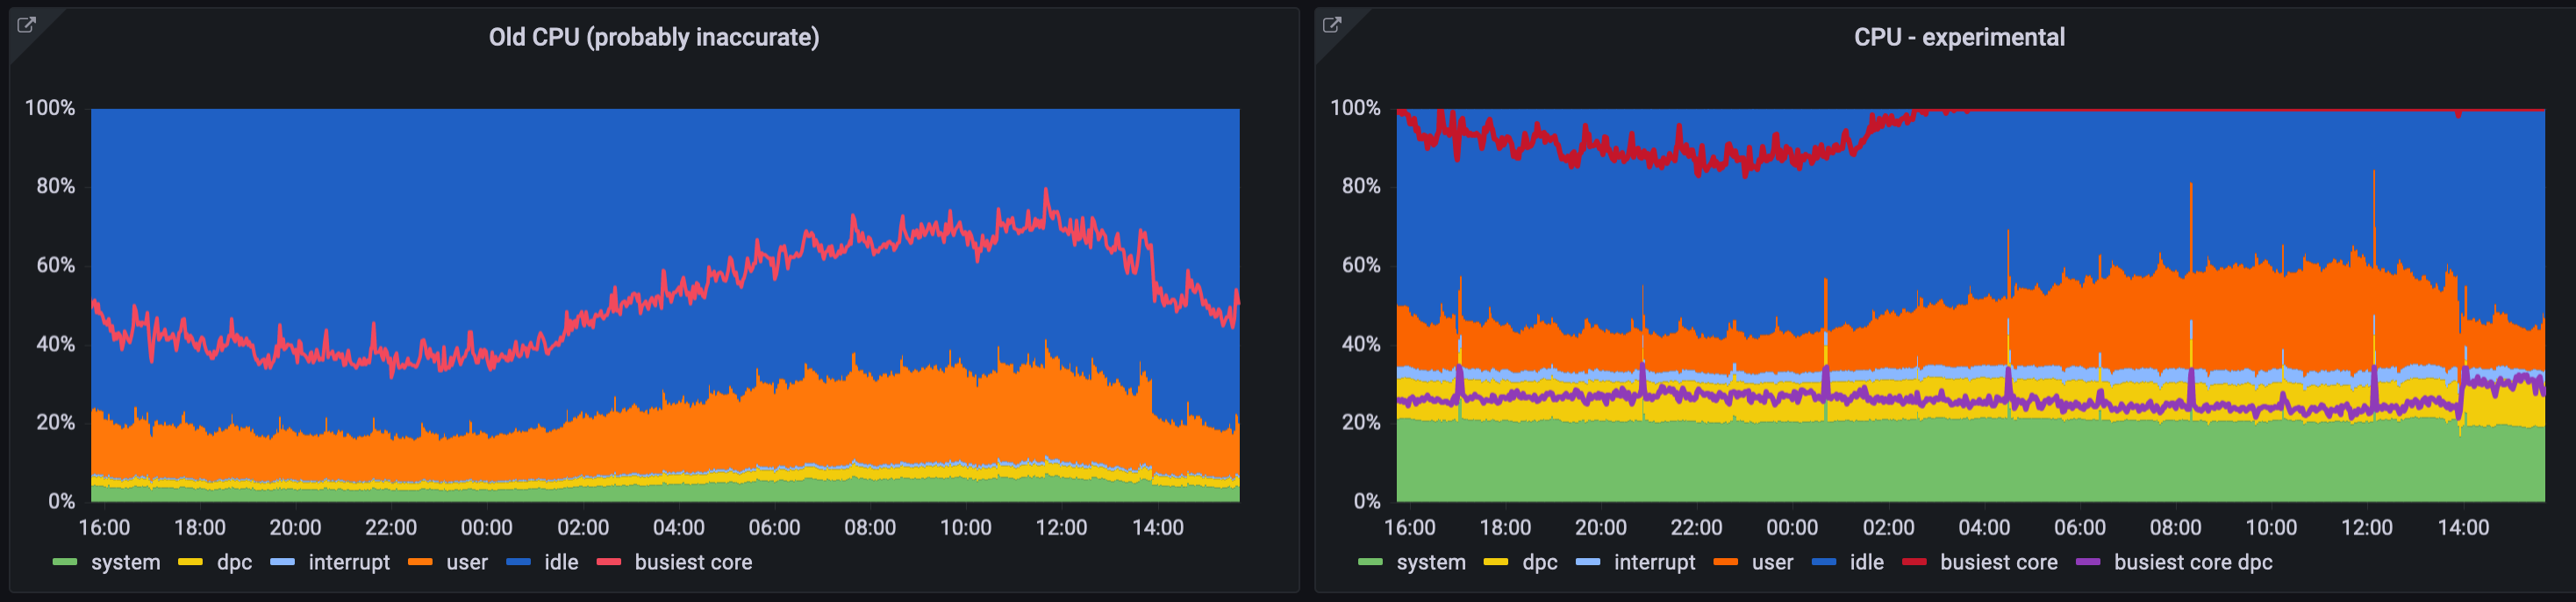
(busiest core and busiest core dpc are overlaid lines and not part of the stack)
perflib_exporter changes LGTM - just make a PR and I'll merge them and make a release.
Great work! Once the perflib_exporter change is merged, raise a PR for the windows_exporter changes and we can get them merged.
Any news on this? Is this merged, PR created? Currently on version 0.20.0 there is same issue with measuring CPU usage.
Here's a new perflib_exporter release: https://github.com/leoluk/perflib_exporter/releases/tag/v0.2.0
Apologies for the delay, I must have missed the notification for this. Dependency has been updated in #1084
I will hopefully have time to get my changes rebased and submitted this week. Thanks all for your work on this!
This issue has been marked as stale because it has been open for 90 days with no activity. This thread will be automatically closed in 30 days if no further activity occurs.